-
Landslide hazard

The landslide hazard map matches quite well with the Vancouver topography. Some noise exists because of the presence of house roof.
-
Liquefaction hazard

In this map, the darker areas have relatively solid surface soil, thus are less susceptible to earthquake damage. The light areas have loose soil and are associated with great shakes when earthquakes occur.
- Tsunami hazard
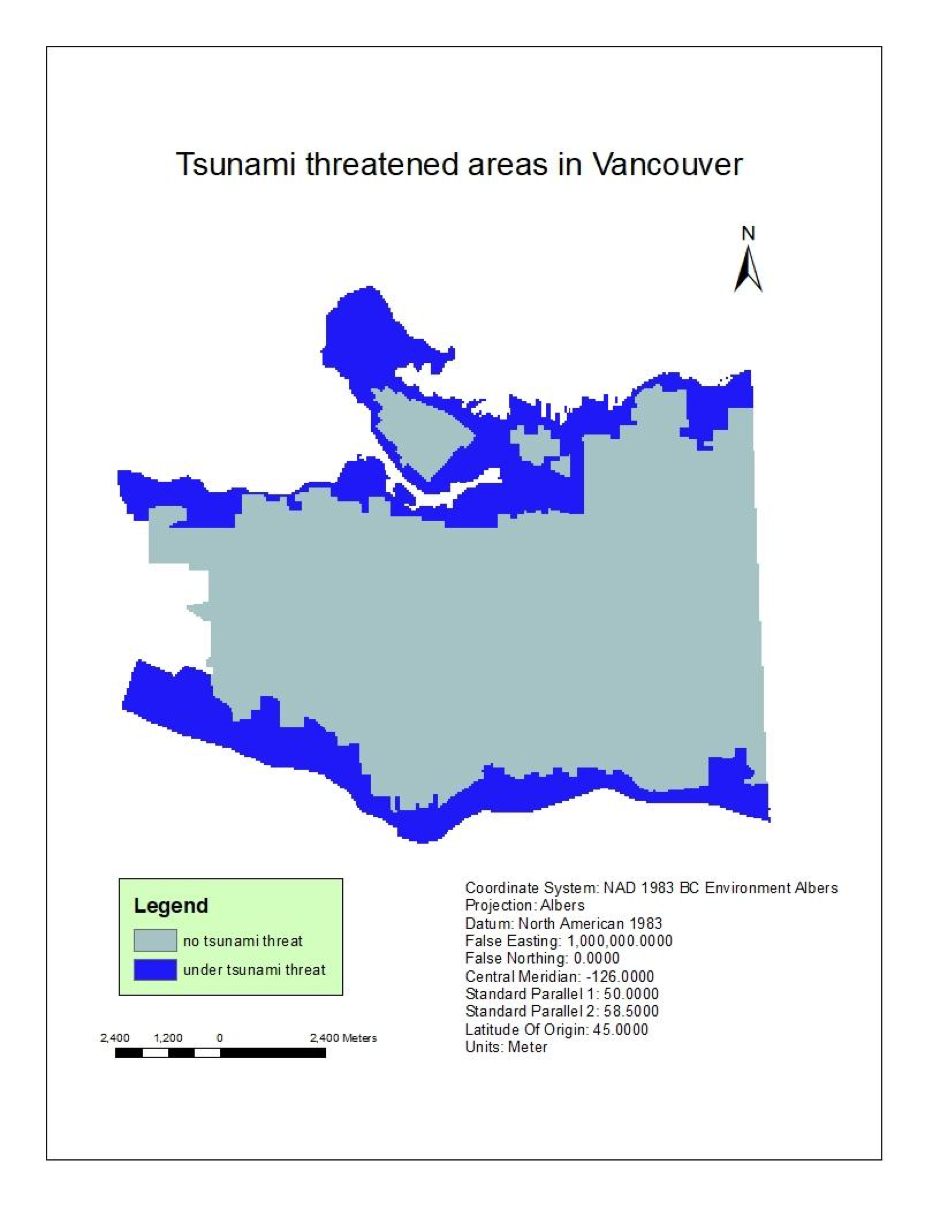
As shown on this map, the blue areas are the blocks that may be submerged by a tsunami after an earthquake. The green inland areas are relatively safe.
-
Overall Hazard
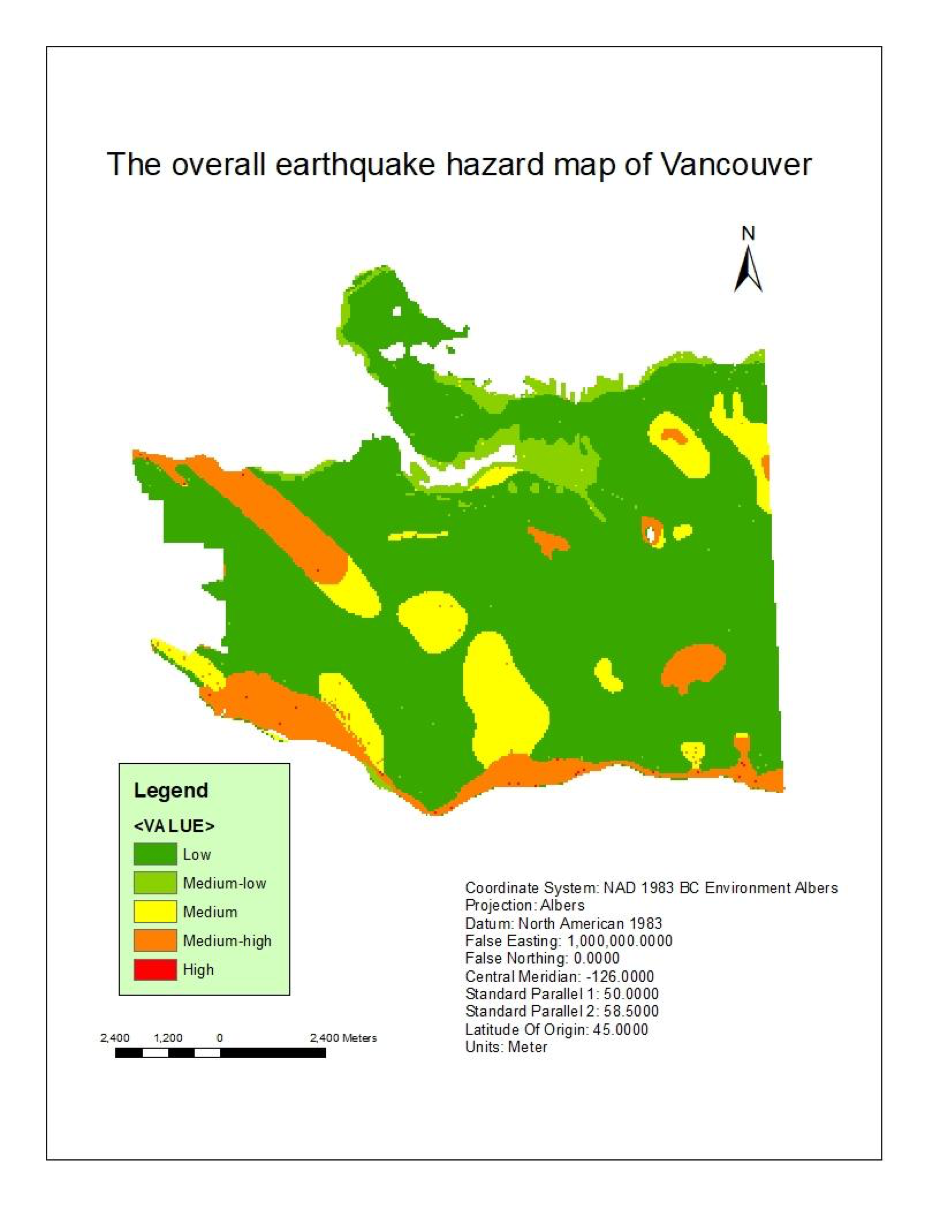
The overall hazard is highest at Arbutus Ridge and the southern coast.
- Population density

The lighter areas have higher population density. When earthquakes happen, those areas may have higher levels of damage; therefore, they have a higher vulnerability index.
- Land-use

Since commercial areas are concentrated in downtown, that area is more vulnerable to earthquake threats, while the dark areas, like Stanley Park and the Pacific Spirit Forest, are least vulnerable.
- Hospital accessibility (2km range)
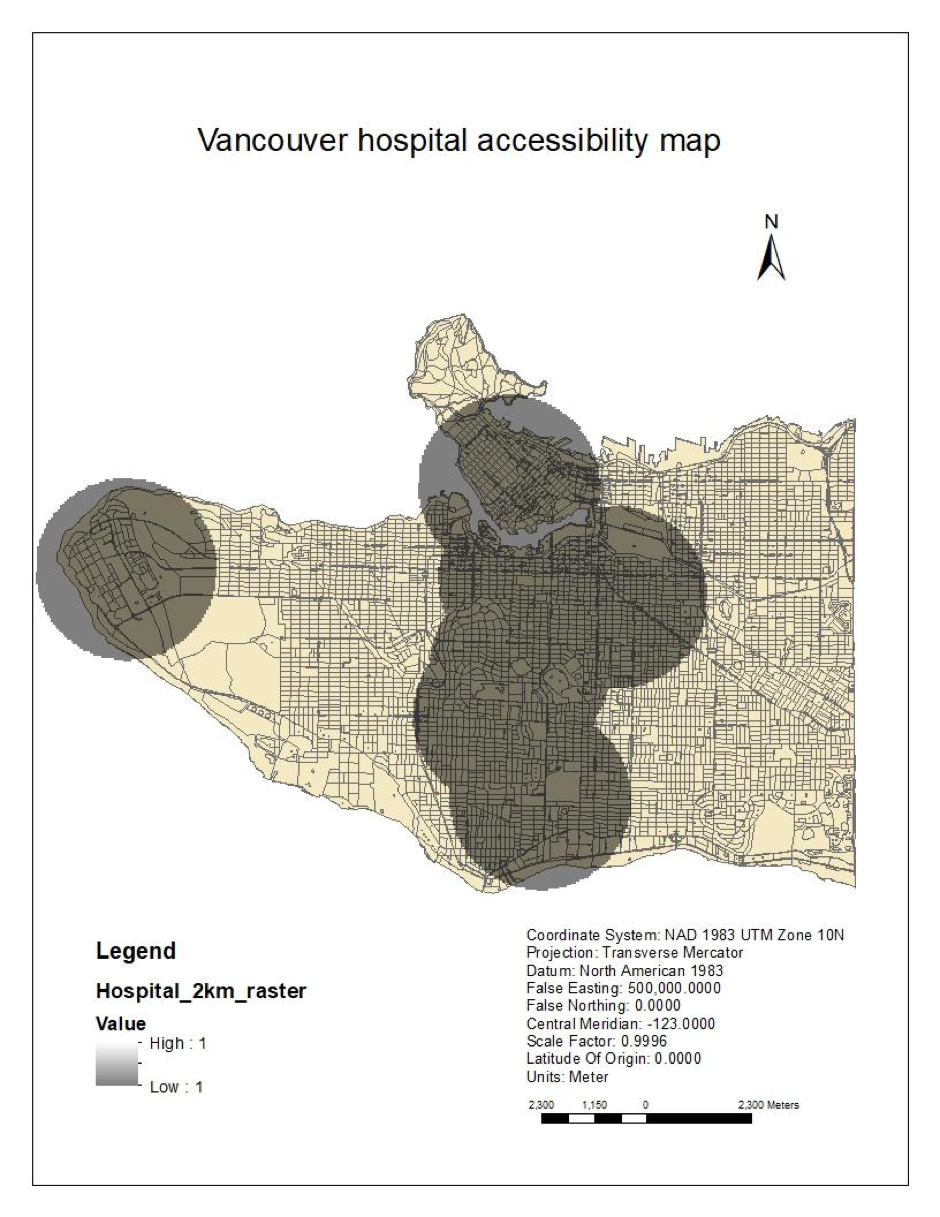
The shaded areas are within a 2km range of big hospitals. Those areas are more likely to receive medical support immediately after a disaster happens, compared to areas with no hospitals nearby.
- Gas-line (500m range)

Similarly, the buffered areas are the areas within 500 m of a gas-line. Those areas have the danger of natural gas leakage and even pipeline explosion.
-
Overall Vulnerability
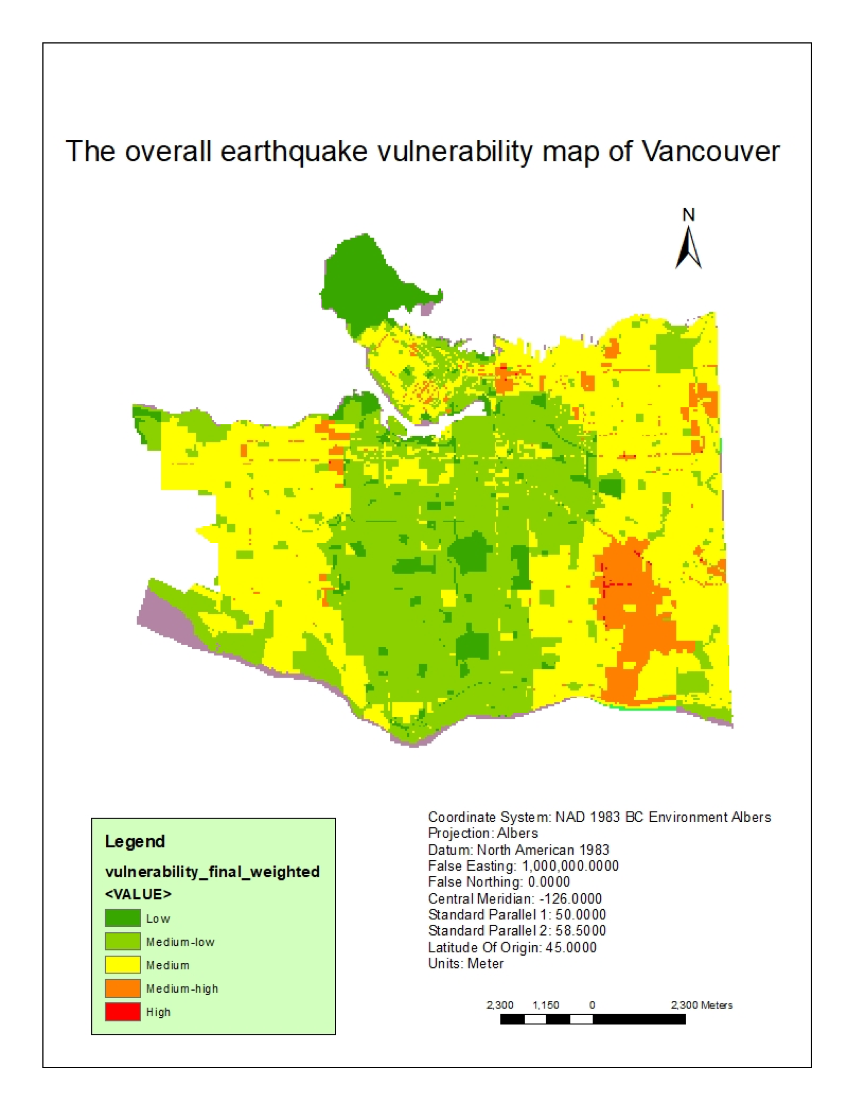
The overall vulnerability map suggests that the middle region is least vulnerable, while downtown Vancouver, the west districts, and the east districts in connection with Burnaby are most vulnerable.
- Overall Earthquake Risk (generated by hazard * vulnerability)

According to the final overall risk map, the Arbutus Ridge and the southern coast are most at risk of earthquake threats.