Sign up for project proposal presentations (held on 27 Feb or 29 Feb) here.
Sign up for final project presentations (held on 11 Apr or 13 Apr) here.
Choosing a Topic
In this course, your class project is a significant component. In order to complete a project you need to identify a topic (or partner with someone who has identified a topic that is of interest to you) that will enable you to use your GIScience skills and demonstrate the practical knowledge that you have gained in GEOS 270 and GEOS 370. You should select a topic that is of interest to you. If you are focusing on urban geography in your studies, consider working on something that uses census data (examples presented here: assessing community needs and resources); if you are mostly studying physical geography, check out the SAGA (Software for Geoscientific Analyses) web site and in particular look over the tools that are provided). The Whitebox Geospatial set of tools is also worth reviewing. For Human geographers, this text on GIS and the Social Sciences is definitely worth taking a look at.
I very much suggest that everyone discuss their proposed projects with the TA and/or me, since we may be able to provide some useful guidance (e.g., where to look for data, how other students have addressed the issue). Finding appropriate data sources for your project is often the most time consuming component; thus, project topics will often be constrained by data availability. Choosing a good topic to work on is challenging, but we can provide guidance and suggestions along the way. Given time constraints, you might have to start with what data is available and then see what sort of interesting questions we might ask that this data will help us understand.
The below links may help you discover some project ideas:
- A listing of 1000 GIS applications!
- Click here to view completed projects by previous classes
- Directions Magazine
- ArcUser Magazine
- XYHT Magazine
Because of the substantial amount of work required to complete a project, it is important to plan ahead. If you do plan ahead you will find the project and the learning process both fun and challenging. Previous students emphasize the importance of deciding on a project topic early on in the course. This will allow you time to obtain the needed data and identify the appropriate research methodology early on, and, when the data glitches and analytical snafus occur--and they almost always do--you will time to work around them.
Guidelines for Project Proposal Presentations and Summaries
- A statement of who is involved in your project (e.g., the 'team').
- A title for your project, as well as a short description of what you hope to achieve in your project (depending on what sort of geographical inquiry you do, this could be your 'hypothesis', or what sorts of questions you are posing, or what concept you hope your inquiry will shed light on, etc.).
- A very short description of the data that you will be using in your project, and an indication of whether the data is 'in hand' or has to be obtained.
- Any other important facts you would like to present to the class, such as the advanced methods you plan on using for your analyses.
Note that you will only have a a few minutes per presentation, so you must come prepared (with all of the details written down so that you know exactly what you will be saying). You could prepare a short powerpoint presentation (4-5 slides) in which you provide the details mentioned above, and screen share it with the rest of the class.
Important considerations when developing a project proposal:
- Your foremost consideration is the identification of an appropriate question or research hypothesis. What is the goal of your project? What do you hope to learn / achieve / unpack for further research / demonstrate through the completion of your project?
- Another important consideration is the need to emphasize spatial analysis--every project must entail some elements of advanced spatial analysis (i.e., producing simple maps that compare the distributions of two phenomena is not advanced spatial analysis). Note that you can draw methods from what you learn in labs, but good projects don't just repeat a lab in slightly different circumstances.
- Although there are exceptions, in order to conduct meaningful spatial analysis, you typically want to have more than 25-30 spatial units (e.g., points or polygons).
Some useful resources:
- A site that describes computational archaeology.
- Some predictive modelling resources.
- GIS tools for connectivity, corridor, or habitat modeling.
- An article on estimating precipitation in mountainous environments.
- Snow indices and satellite data: NDSI, some issues NASA identifies with NDSI, a comparison with IR values.
- Geospatial Modelling Environment (GME) software--useful for many forms of analysis, in particular it provides a link to the R statistical program.
- An overview of methods of spatial data analysis available through R.
- ESRI's technical blogs cover many topics such as 3D GIS, analysis, editing, python.
- A useful resource for those planning on doing some form of hazards analysis in their projects: Northern Hazard Mapping Methods
Deliverable:
Each team is required to submit a one-page electronic summary by the end of Monday after their presentation. Not dissimilar to the presentation, the summary should include:
- A statement of who is involved in your project (e.g., the 'team').
- A title for your project, as well as a short description of what you hope to achieve in your project.
- A listing of the data that you will be using in your project, and an indication of whether the data is 'in hand' or has to be obtained (a table works well for this).
- Any other important facts you have presented to the class.
- But do explicitly incorporate/respond to feedback you received during your in-class presentation to the extent you can! You can only achieve this if you've presented, of course.
Assessment
The project marking scheme is outlined here, along with a few additional helpful hints.
Guidelines for Final Presentations
Presentations take place the last week of classes. It's important we are all there to offer support, to ask questions that people can use to revise their approach, and to learn more about the diversity of topics that GIS allows one to engage!
Please plan for your final project presentation to last no longer than 5 minutes. As such, you need to carefully consider what content is important to cover in your presentation, and what content should be left out. For example, you should NOT spend any of your presentation time describing how many hours were required to clean up your data, etc. Rather, your presentation should contain:
- A short statement about your project (e.g., The goal for our project was to develop an inundation model of a 10-metre high tsunami for the Metro Vancouver region. Our model identified the potential risk of inundation with respect to elevation and distance from the coast. The areas at highest risk of inundation include the low-lying cities of Richmond and Delta. An estimated 400,000 ± 165,000 people reside within the forecasted risk area. Or The goal of our project was to analyze the potential effects of the Northern Gateway Pipeline on the environment and the peoples living along its route. Using multiple parameters we created different cost surfaces that were used to model different potential pipeline routes. Then, using our generated routes, as well as a route that Enbridge has proposed, we analyzed the pipeline's potential ecological and socioeconomic impacts along its path.)
- A very short statement of your data sources (e.g., We obtained our data from DMTI and Statistics Canada; as well, we georeferenced some of the data ourselves. Or We obtained our data from NASA's Shuttle Radar Topography Mission as well as from the Climate BC web site.)
- A short discussion on the methodology used in your project ( e.g., We followed the classic Multi-criteria analysis methodology in our project--we identified the factors (list them out) and constraints (list them out) relevant to our goal and, after standardizing them, we used a weighted sum to identify the potential sites.).
- A discussion of your results and conclusions This is where you should spend much of your time--identifying your important results (e.g., presenting your maps) and discussing what they show, and then indicating whether or not your analyses achieved the goal(s) you had established.
Given these guidelines, it is important that you go over your presentation before you give it in order to ensure that you can navigate through your web site (or slides) and find the relevant materials within the time limits. It is required that, in your web site, you do fully describe your data sources (and, having links to the data sources is always a good thing), and your methodology. Given the time constraints, however, there simply isn't enough time for everyone to cover every aspect of their project.
Project Website
Your project should have an abstract (a paragraph summarizing your project), something equivalent to a table of contents, an introduction, a section describing the methods and data used, the results, and a conclusion. It is also important to identify all of the project team members on the project's home page.
Basically, there are two preferred methods of creating your final (online) project report. You can use a blogging platform. UBC Blogs provide the easiest solution--and they make it easy to keep your site private if you don't want it to either serve as evidence of what you've learned in a portfolio or inform the broader world about your topic. Regardless, make sure that we can access your site. For the more adventurous, you could use an ESRI's Story Maps to host your project. (StoryMap tutorial here.)
Fine Details
You must follow the following details in creating your project web pages:
- Spell checking is absolutely necessary! If your editor doesn't support spell checking, it is a good idea to cut and paste your text into a word processor and run a spell check in order to ensure that you have no errors.
- As a general practice when working with web materials, it is best NOT to have any spaces in your filenames (e.g., Final Map Showing Results.jpg should be named finalmapshowingresults.jpg)
- All images used in your project must be properly cited (that is, where did you obtain that picture from?) and, typically, you should obtain permission first before using someone else's images.
Graphics to the Web
A picture is worth a thousand words. Chances are that you will want to use graphic images to convey information about your analysis and to show people the results. Note that web pages can only display a limited number of the possible graphics files formats (e.g., web browsers cannot display Window's emf files, but they can display gif, jpg and png images), so it is important that you explore all of the export options before deciding upon a final format. (For a complete listing of all of the known file extensions, check out the FILExt web site. They also list viewers for many of the extensions.)
Methods you can use for capturing ArcGIS's images are:
- ArcGIS's Export
- Capturing a 'screen shot'
- Creating a PDF
Important consideration: You need to ensure that the images (maps) are legible. That is, if the image is too small it becomes difficult to discern the details. To alleviate this as a concern you can create smaller static images of the maps and link them to PDFs or larger versions of the files that can be viewed by clicking on the smaller static map.
ArcGIS's Export
This is the preferred method, which uses the export capabilities of ArcGIS to create a placeable Window's Enhanced Metafile, a gif file, a jpg file, a PDF, etc. Once you have the map created (with all of the elements, such as the legend and scale bar, properly placed) simply use the File / Export menu to save the image as a Windows Enhanced Metafile (*.emf) (or as a *.jpg). You can then use a graphics program such as GIMP to adjust the image, if necessary, and to save the image in a web-friendly format. Always confirm the Export Options to ensure that the resolution, etc. are what you want them to be. Also, read over the ArcGIS Help file on "exporting maps" for additional tricks you'll need to know.
Capturing a 'screen shot'
This method varies a bit by your version of your operating system. If the exact approach described here doesn't work, consult this page: https://www.take-a-screenshot.org/
The simplest approach, classically, in Windows uses the Print Screen key that may be located beside the F12 key on the top row of the keyboard. By pressing this key the whole screen is captured as an image to the Clipboard (in the computer's memory). Windows also has the Clipping tool that is more flexible to use. To use this image you can either open Clipboard and save the file as a CLP (clipboard) file or go to a graphic management program and paste the image from the Clipboard into an image file. You can also use Window's Snipping Tool to capture part or all of the screen.
Example - Here is a simple walk through of how to use the PRINT SCREEN method to capture an image from ArcGIS:
- Open ArcGIS Pro.
- Create the screen you wish to capture (can be a layout, table, chart, etc.)
- Press Print Screen key on the keyboard.
- Open a graphics program.
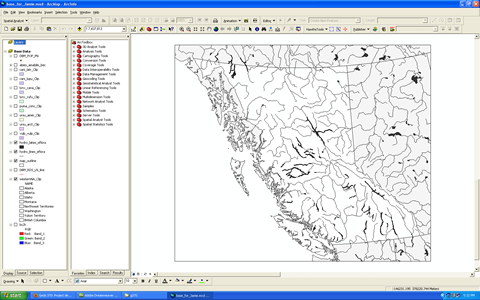
- Select Edit and then Paste, you will see the whole screen capture pasted on the window. Here is a captured screen image.
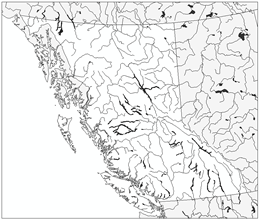
- Now you can edit the image by cropping, resizing, flipping, rotating, adding text and changing colour etc. This is the modified screen image after cropping.
Graphic Software
Some of the more popular graphic management programs that handle bitmapped (raster based images) are GIMP (free to all and available in the Geography Computer Labs) and Window's Paint. Images that are saved as Screen-dumped (can be called somethingsomething.bmp) files can generally be opened directly from within these types of programs. In addition, the clipboard contents of a screen capture can be pasted directly into these programs. One of the advantages of using a raster-based graphic management program to handle your screen capture is that you can edit and manipulate the image to your liking before saving it, allowing you to crop out window borders, menu headers, and other unnecessary information.
Vector-based drawing programs such as Illustrator (available in the Departmental Computer Labs) or Inkscape (free to all) are also useful for manipulating saved images. Bitmapped Screen-Dumps, however, can typically only be imported (but not modified) when you are using a vector-based program such as Illustrator ("Import" is usually found under the "File" menu in most programs). Once the image is imported, a user can add lines, curves, coloured boxes, and artistic text around the image (especially useful when annotating an image in a project!). However, the imported image itself cannot be edited in a drawing program; it must first be manipulated in a raster-based graphic management program.
Copyright and credit
It is important to respect copyright when creating your web pages (e.g., using images from another site, taking quotes from publications). You must properly source all materials used on your pages. The library has a webpage dedicated to copyright issues: http://copyright.ubc.ca/students/ as well as this page on how to properly cite images: http://copyright.ubc.ca/guidelines-and-resources/support-guides/image-sources/.
Bottom Line
Incorporating images to your project may enhance the quality and appeal of your project.
Project Examples
The entire class projects for several years are posted on the web. With the skills and knowledge you acquire in this course, you should be able to produce a project that excels the ones shown on the Student examples page!