AdapTree in a nutshell
Katie Verigin made this infographic about our project through the Genomics Entrepreneurship program…

Katie Verigin made this infographic about our project through the Genomics Entrepreneurship program…
The following set of pictures was taken by Sally Aitken, Connor Fitzpatrick, Ian McLachlan, Sarah Markert and Pia Smets, during the course of the AdapTree project which ran from July 2011 to June 2015. Enjoy!
1
The Garry oak trial was established by Colin Huebert. A range-wide collection of acorns (2007) was planted first in a greenhouse, then in a common garden in Totem field (2008).
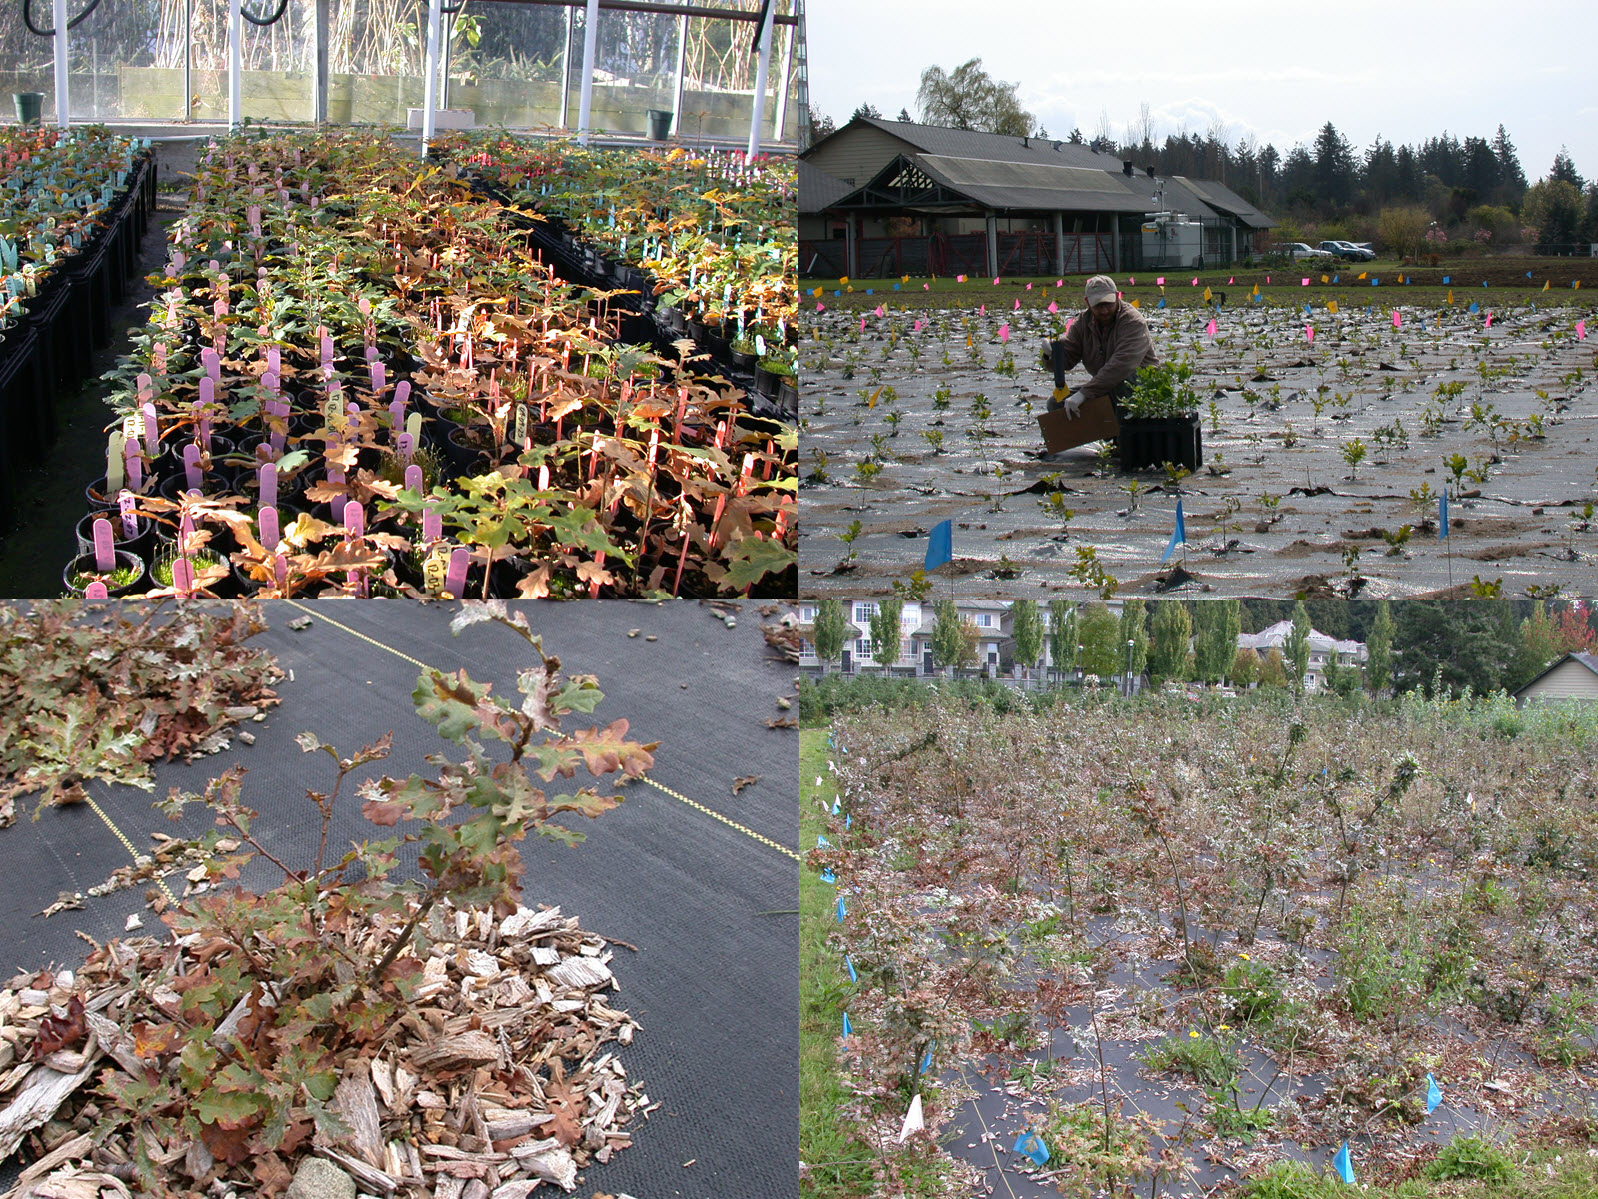
Garry oak in 2008 (top) and 2010 (bottom). Bark chips and landscape cloth help control weed growth.
After a few years, with various people studying aspects of Garry oak, the planting density was a bit tight. Some trees grew really well.
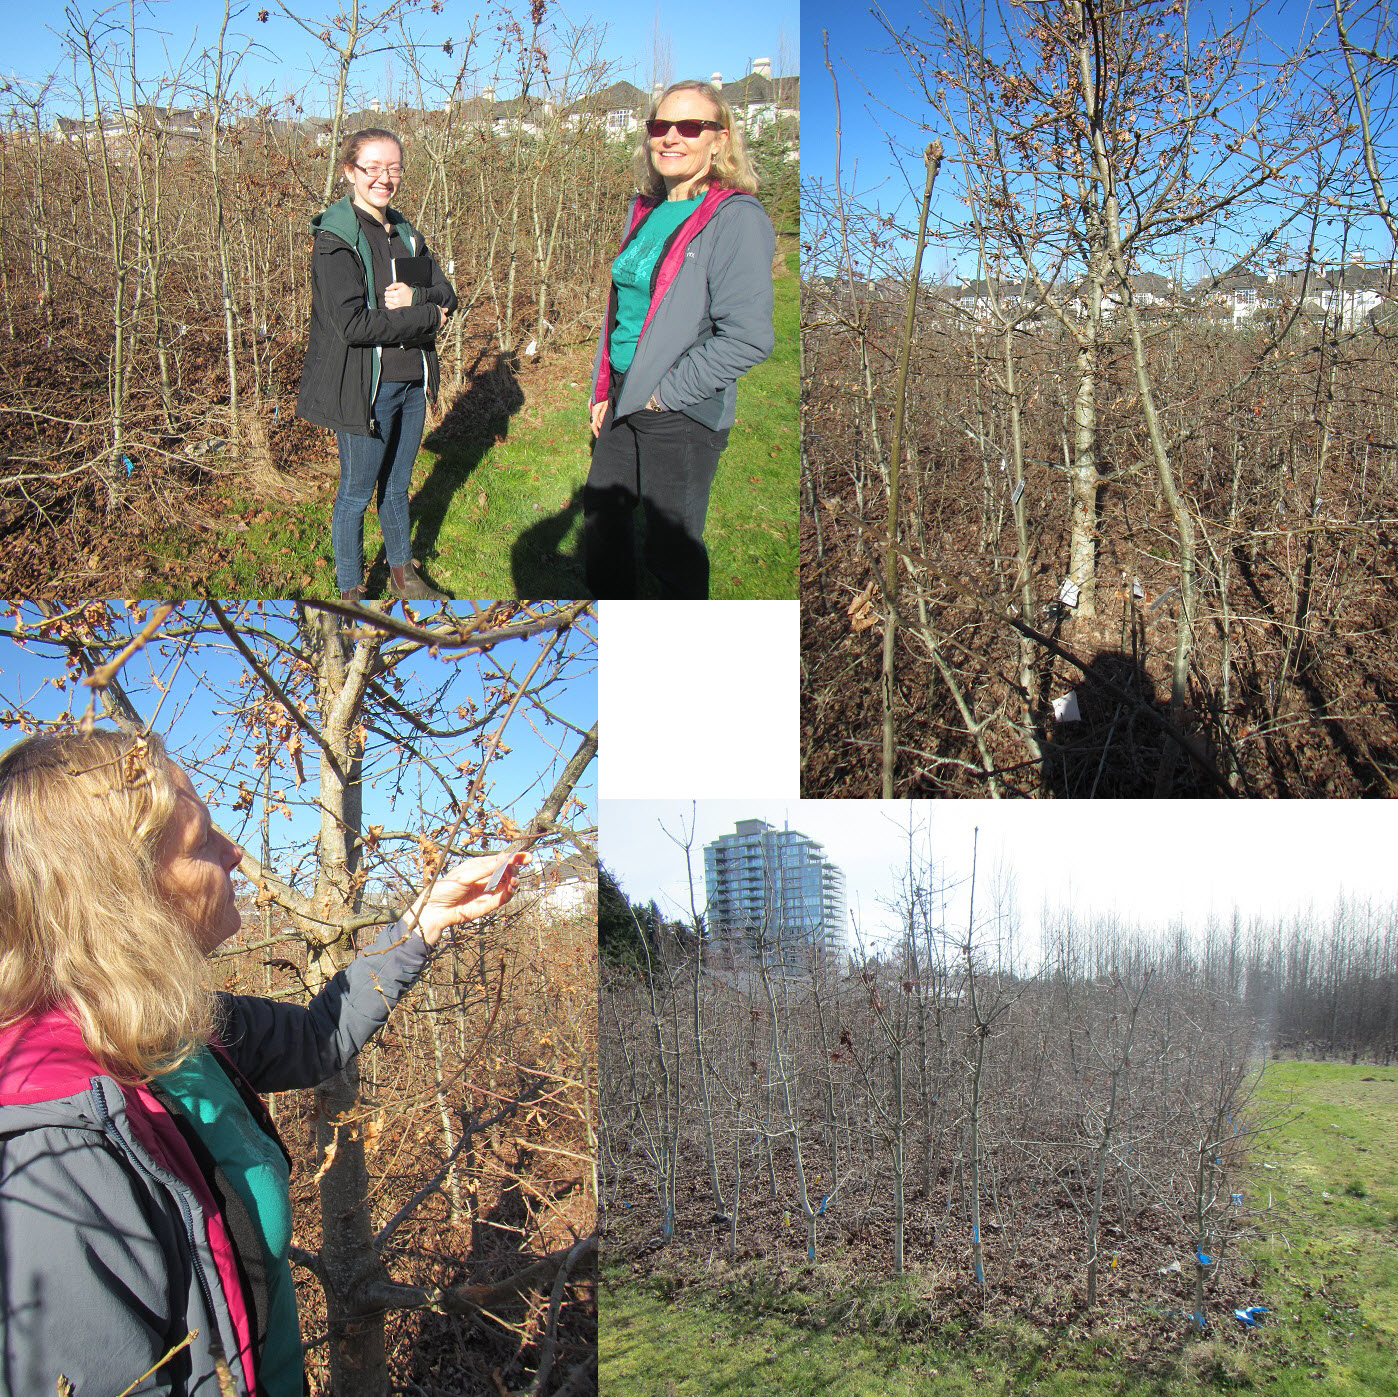
Garry Oak trial in March 2015
A decision was made to thin half of the 1900 trees. The better your trees grow, the more work they require! But, we are not dealing with poplars. Thinning required a chainsaw and a team of helpers. It was definitely a collaborative effort.
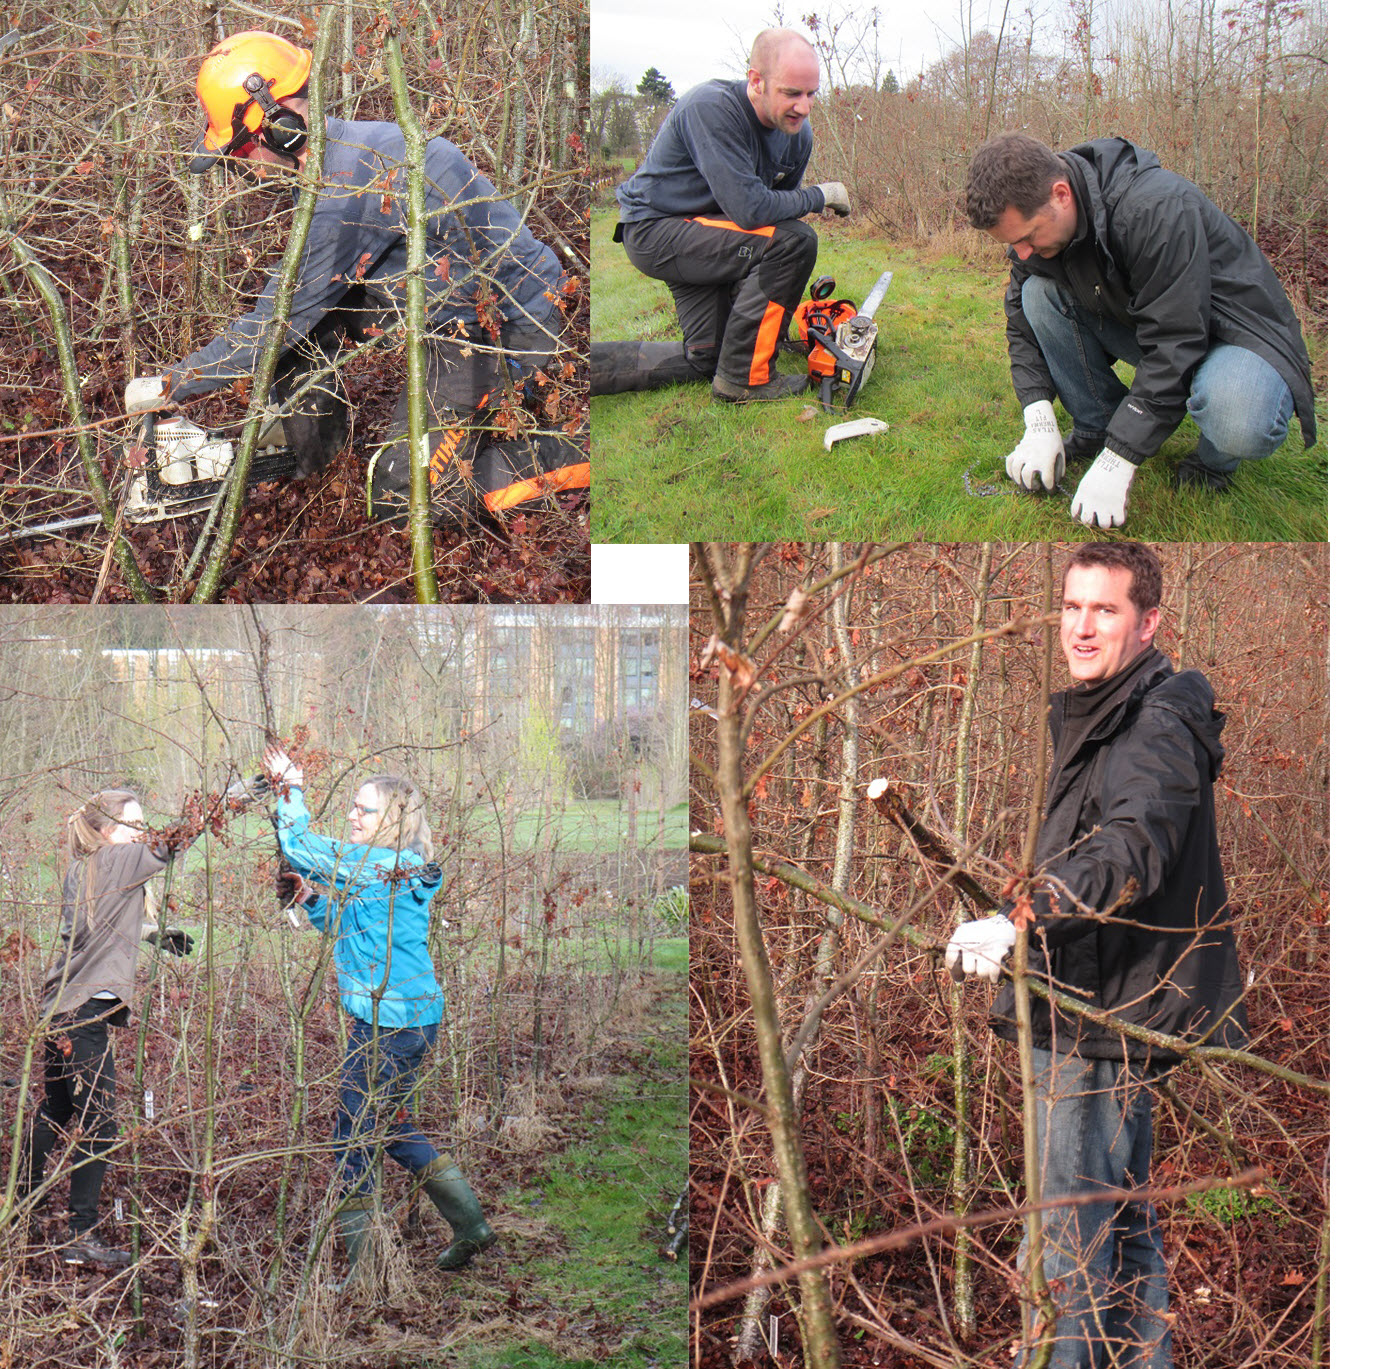
Thinning was a collaborative effort.
But we had fun nonetheless.
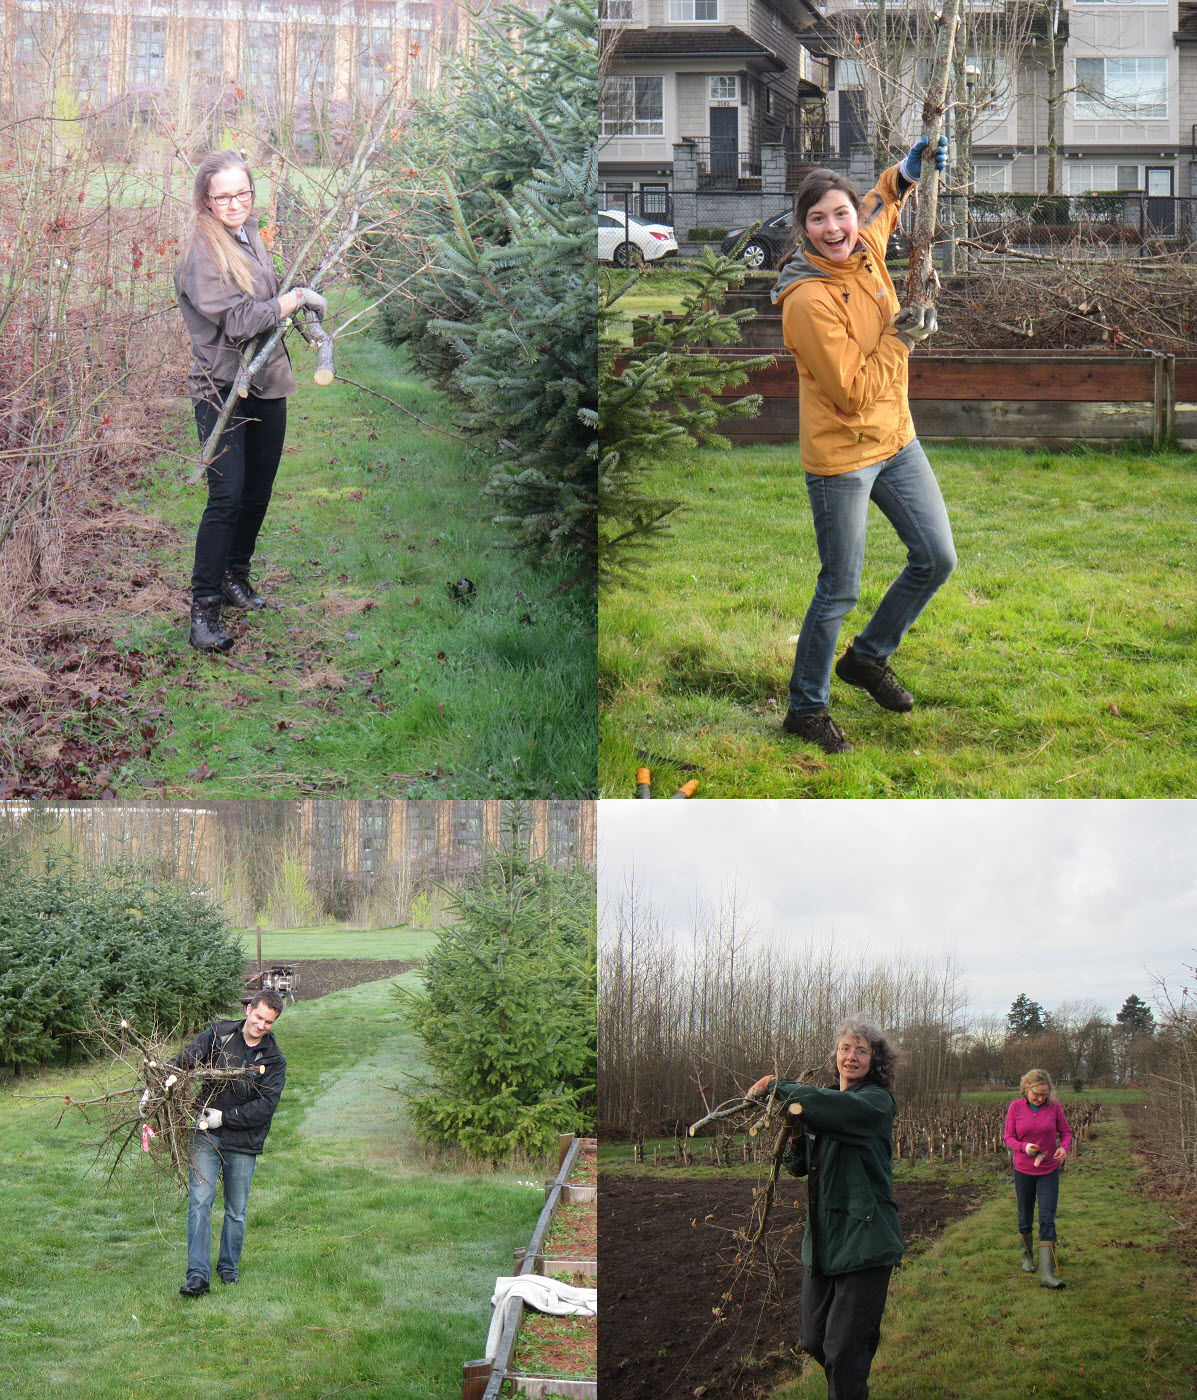
Hard work and fun, too.
This work party provides a good opportunity to single out some demonstration trees to illustrate provenance variation.
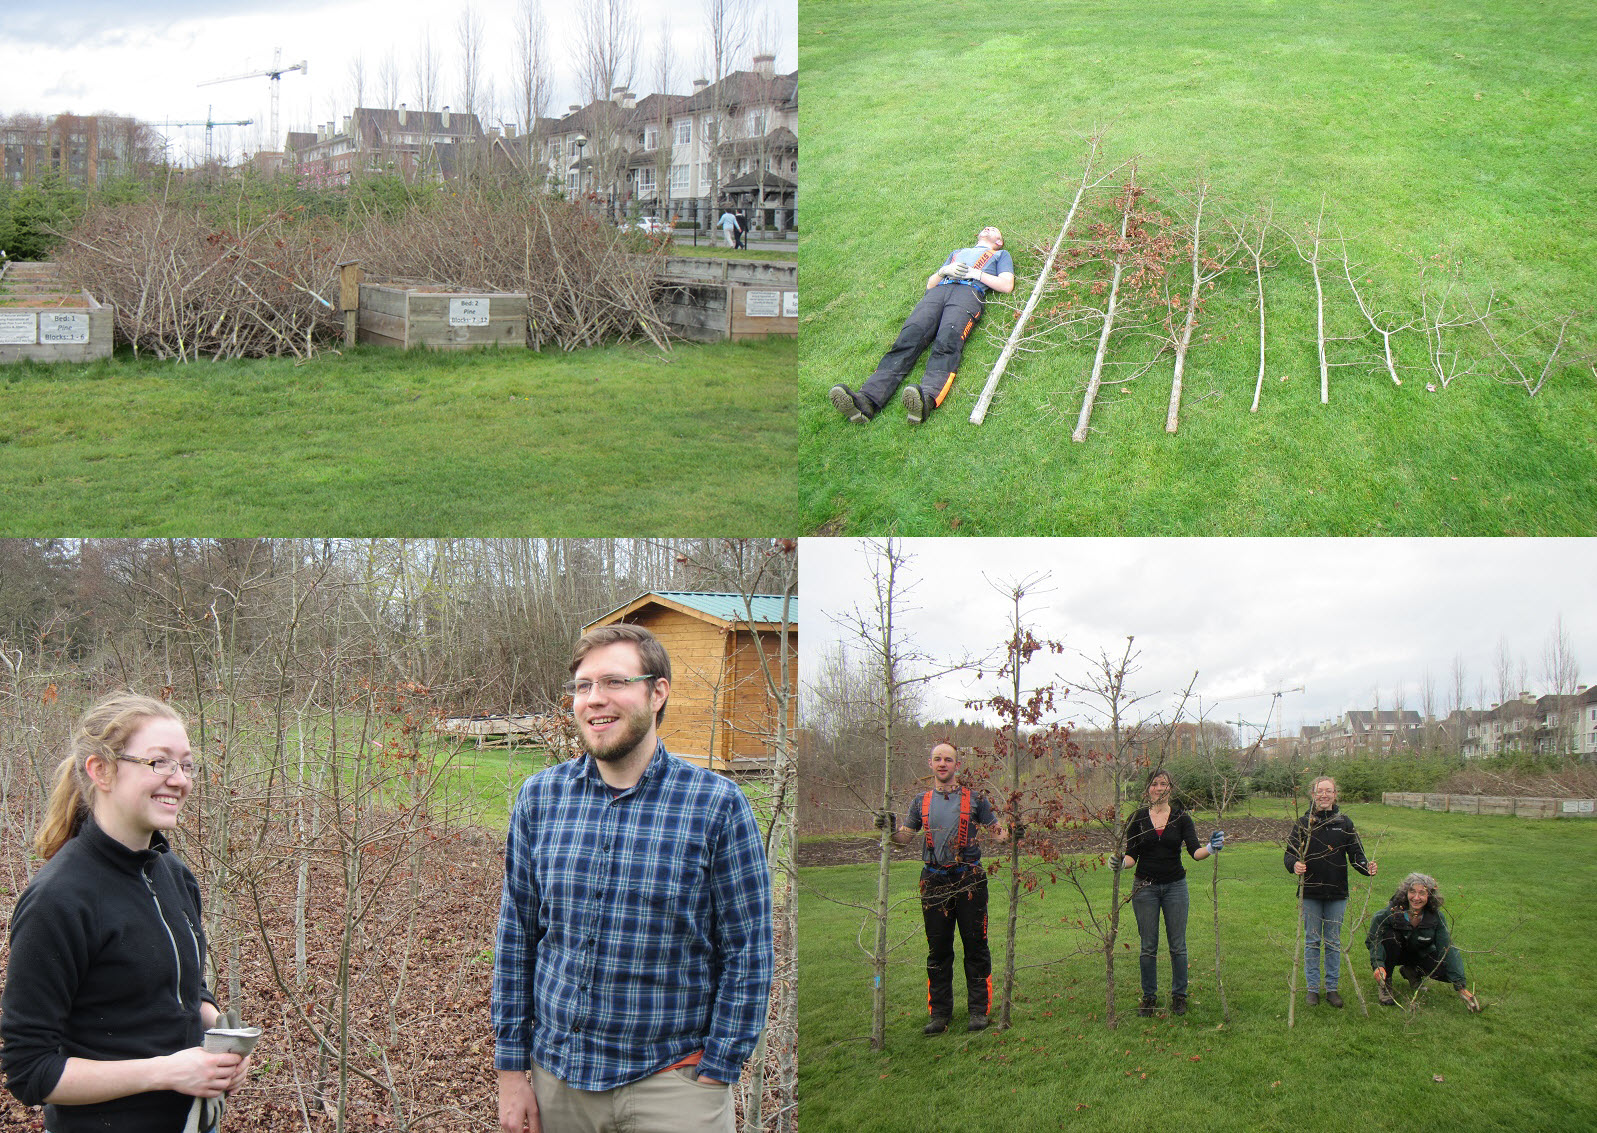
from top left, clockwise: thinned trees waiting to be chipped; provenance variation; discussing past and future research
Who knows which other studies will take place in this trial?
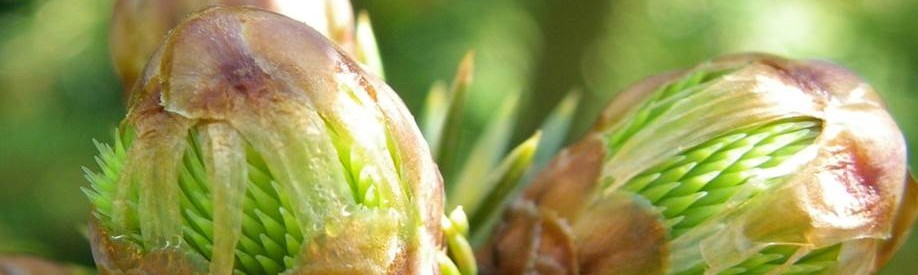
One last experiment of the AdapTree project remained in the ground: the trial comparing natural and seed orchard seed lots. The roughly 6000 plants were kept for a third season to collect periodic height measurements for the pine, and cold hardiness data for the spruce. The spruce trees announced themselves ready for freeze testing by the end of August, so September was dedicated to needle chopping and conductivity measurements. Thousands of them. Three whole weeks. Those who stuck it out were by then thinking with fond memories of the days gone by when the AdapTree team was large and fresh. But we did it, and the resulting data were clean.
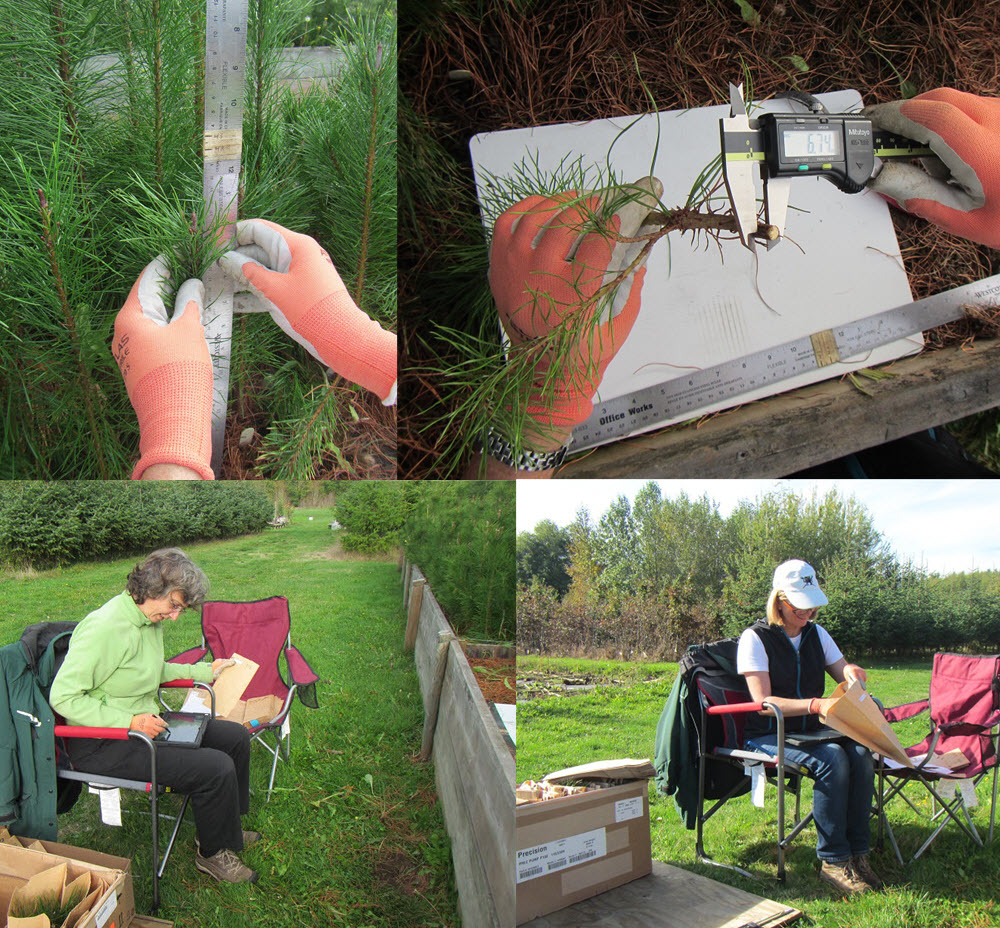
Fig. 1: Pine heights, diameters, data logging and harvesting for shoot dry mass
Nonetheless, it was the middle of October by the time we were performing the final height and diameter measurements on the pine, while simultaneously harvesting them for shoot dry weights. (Figure 1). Harvest time was preferred for diameter measurements because it gives us easy access to the stems. We had sun, we had fog, we had beautiful autumn days and we had rain. Now, we don’t exactly melt from a little rain. But shoving wet plants in wet paper bags which are marked with sticky labels of moderate stickiness is asking for trouble. And while the recording tablets are protected, raindrops beading on a screen are not ideal for visibility. So this became a long, drawn-out affair. Of course, we only take pictures on the nicest days!
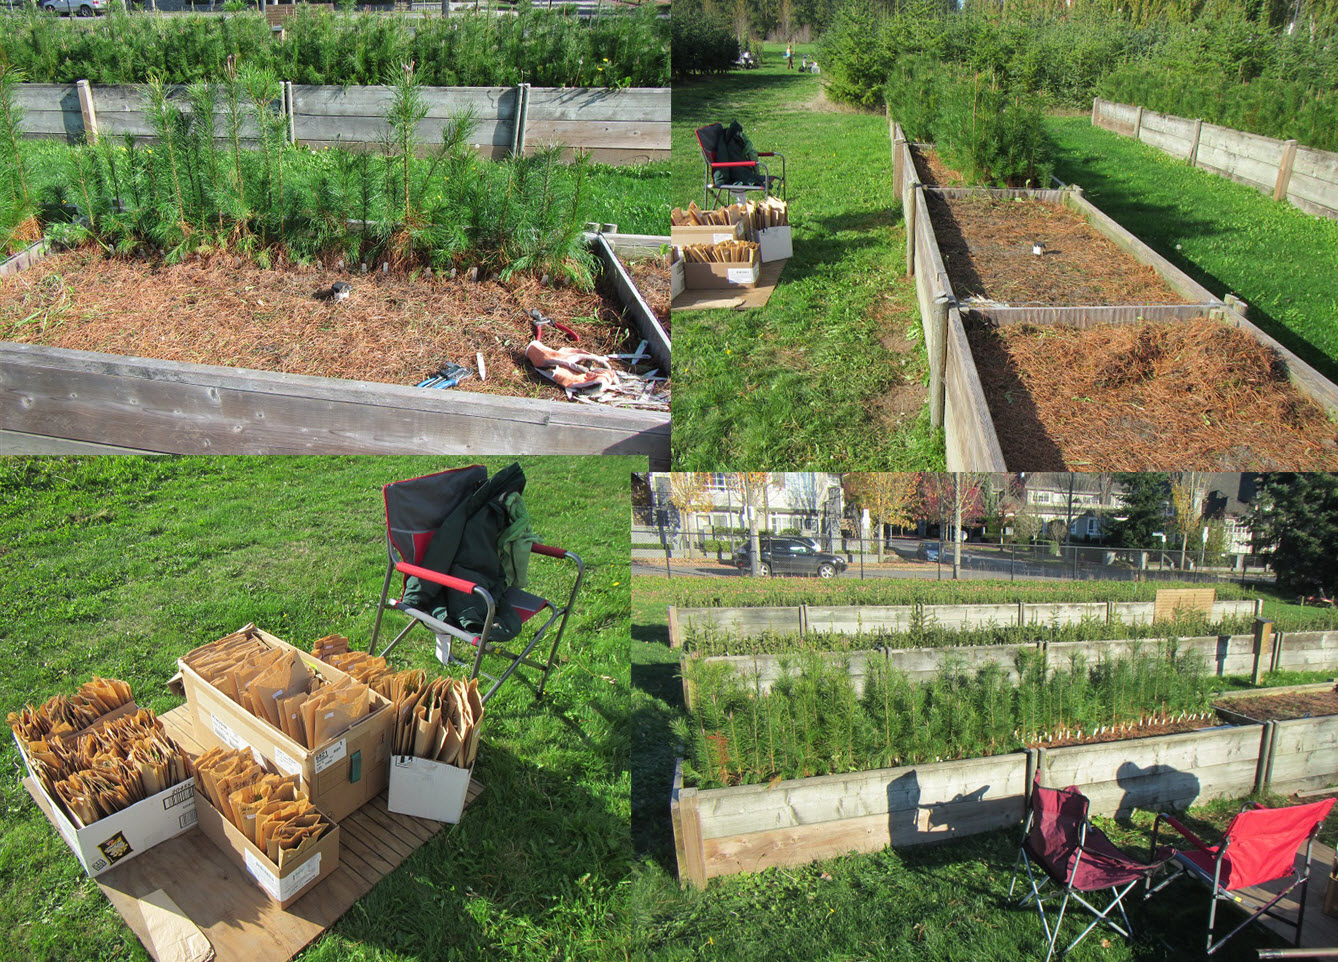
Fig. 2: Gradual progress
The ideal team consisted of three people, so we organized our schedules, waited for the rain to stop, and gradually made progress (Figure 2). We finished the pine and thought we’d just continue at the same speed with the spruce. (Figure 3). Not so. While the spruce plants were much smaller than the pine, the stems were thick and asymmetric, with multiple roots spreading horizontally almost before touching the ground. Individual diameter measurements were not very repeatable, so multiple measurements were taken. Rather than taking turns at measuring, recording and bagging, for consistency’s sake all twelve blocks were measured by the same person. The repetitive bending over proved fatiguing.
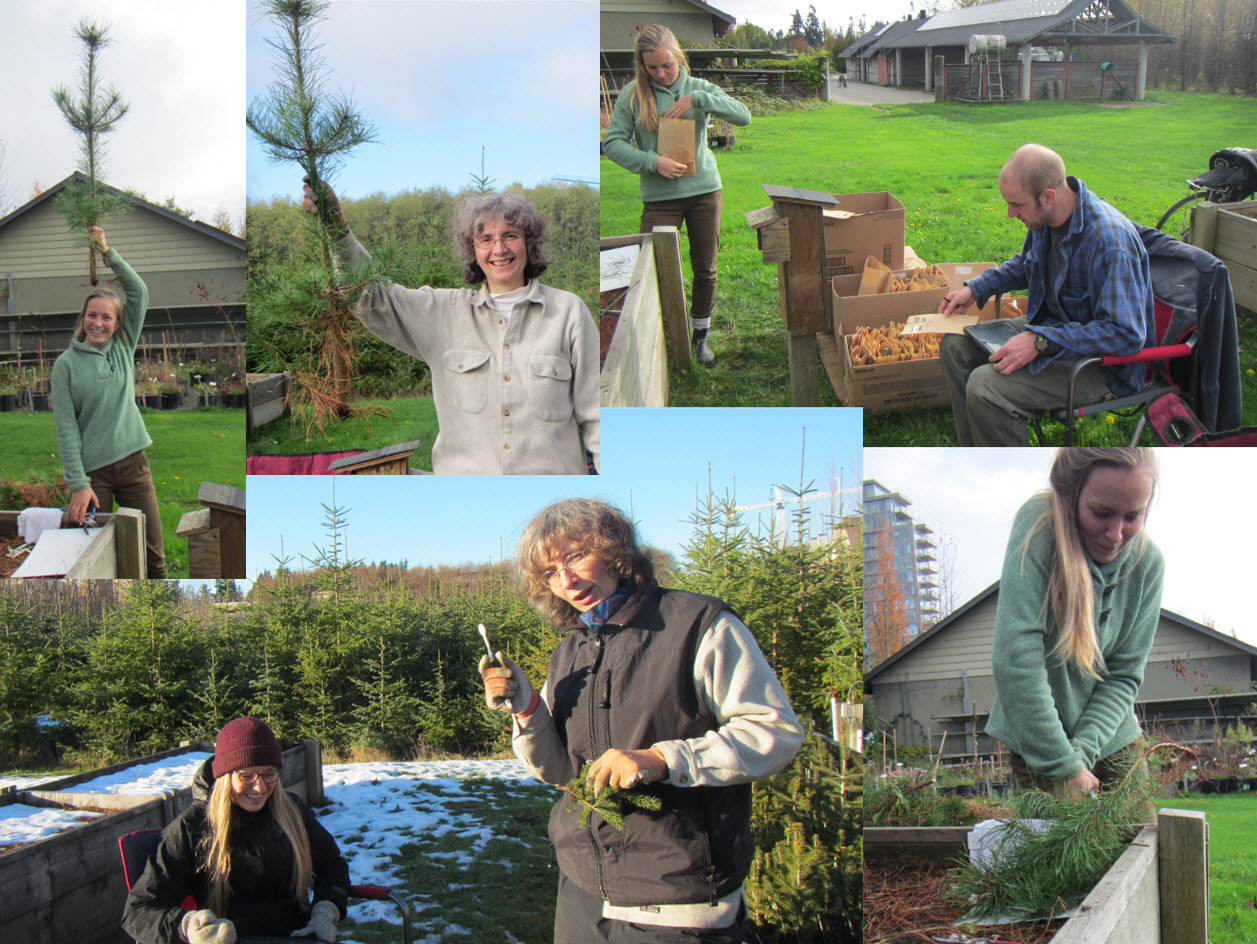
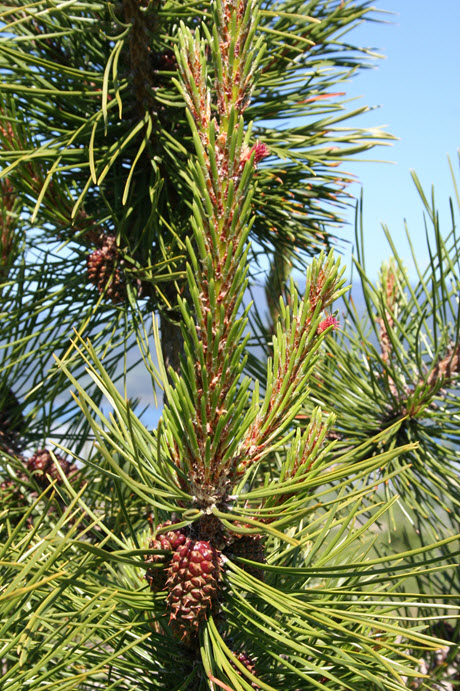
Fig. 3 : Some large pine, and the first snowfall
If you wonder what I am holding up: it’s an old toothbrush, to clean the root collar of sand and mud before taking a diameter measurement.
Then we had frost and snow in November! And the frozen ground in combination with the frozen liverworts and moss did not make a good basis for reliable height measurements – who’d have thought frozen bryophytes could bring science to a halt? As the days got shorter and shorter, we completed the heights separately.
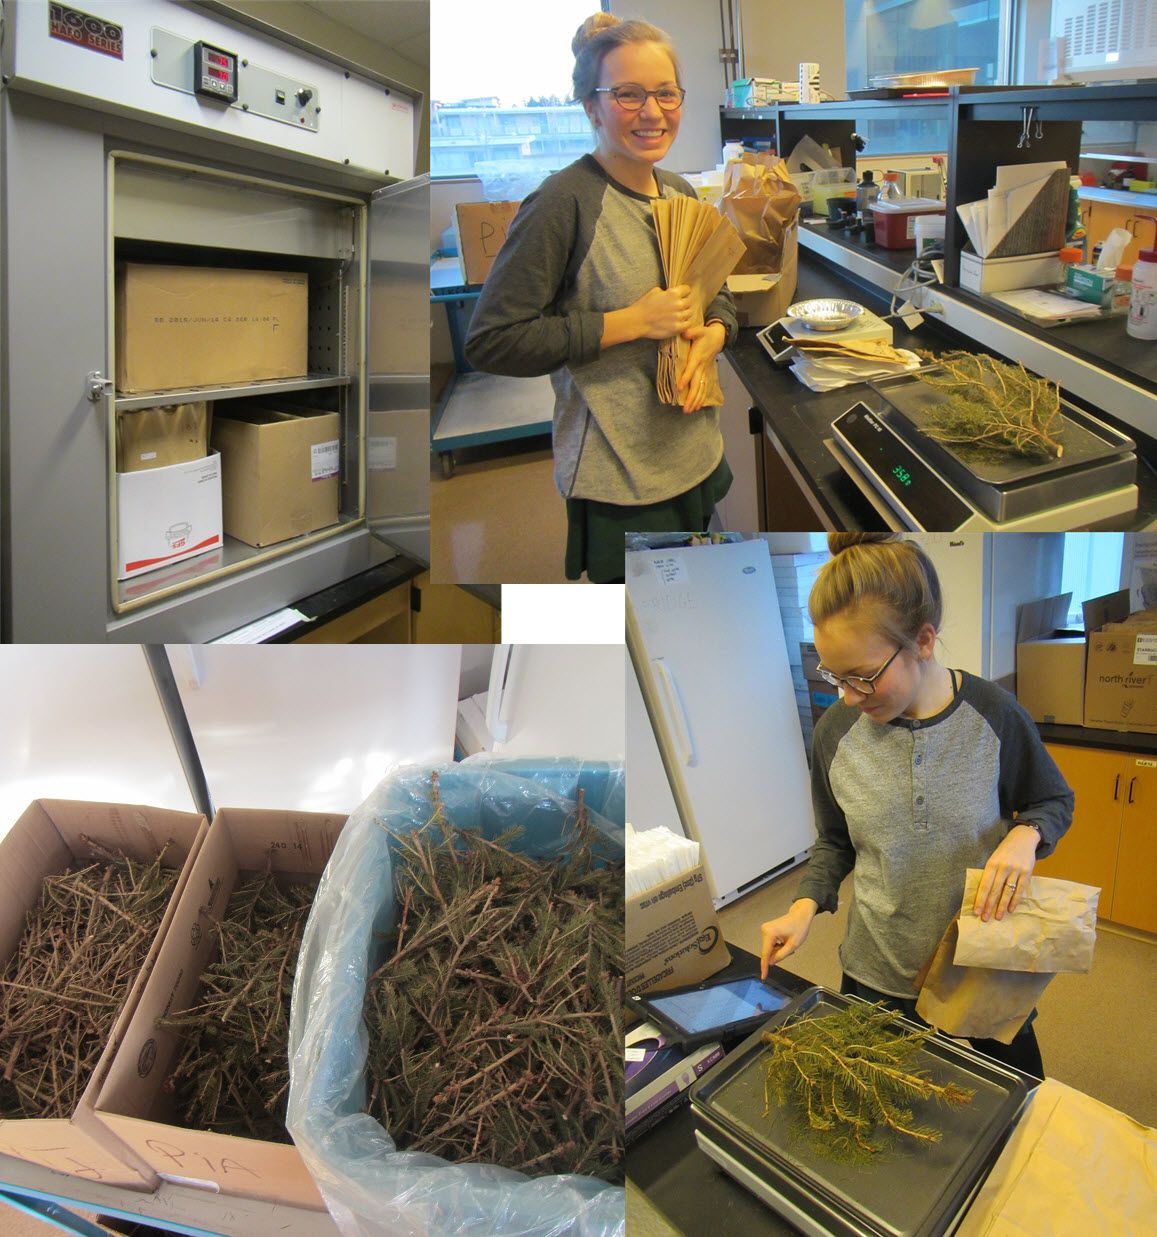
Fig. 4: Dry weights – so many!
In the meantime, shoot dry weights were measured in the lab, to keep the accumulating boxes of dried plants under control. (Figure 4). We didn’t finish before Christmas as planned, and Ian had to wait and wait for his data. With mild weather in the first week of January, we made one last big push, and the last spruce tree was cut on January 9 (Figure 5), with the last dry weights gathered two weeks later.
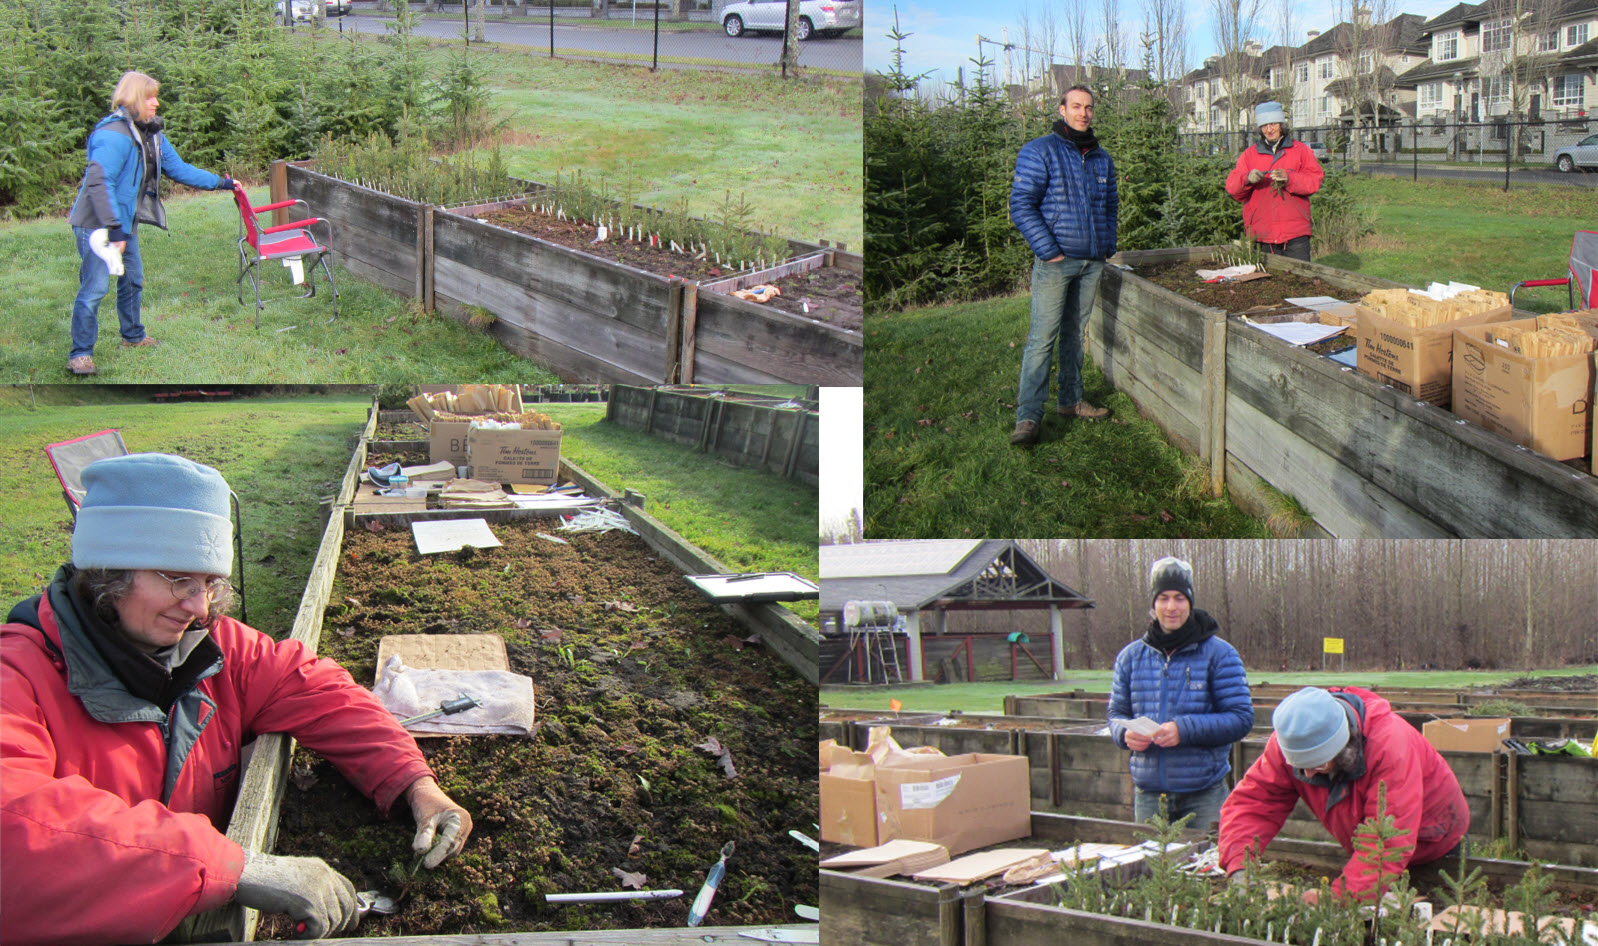
Fig. 5 : The last spruce tree is cut …
And now all the plants are gone and no more measurements can possibly be collected from them!!!
I am grateful to all those who helped out (you can see some of them in the pictures!), and for the hot tub in the swimming pool. Did I mention the guys who (re)built the raised beds in the first place (Figure 6) ? And the summer students who helped sowing, and the technicians and students who collected weekly height measurements (Figure 7) ?
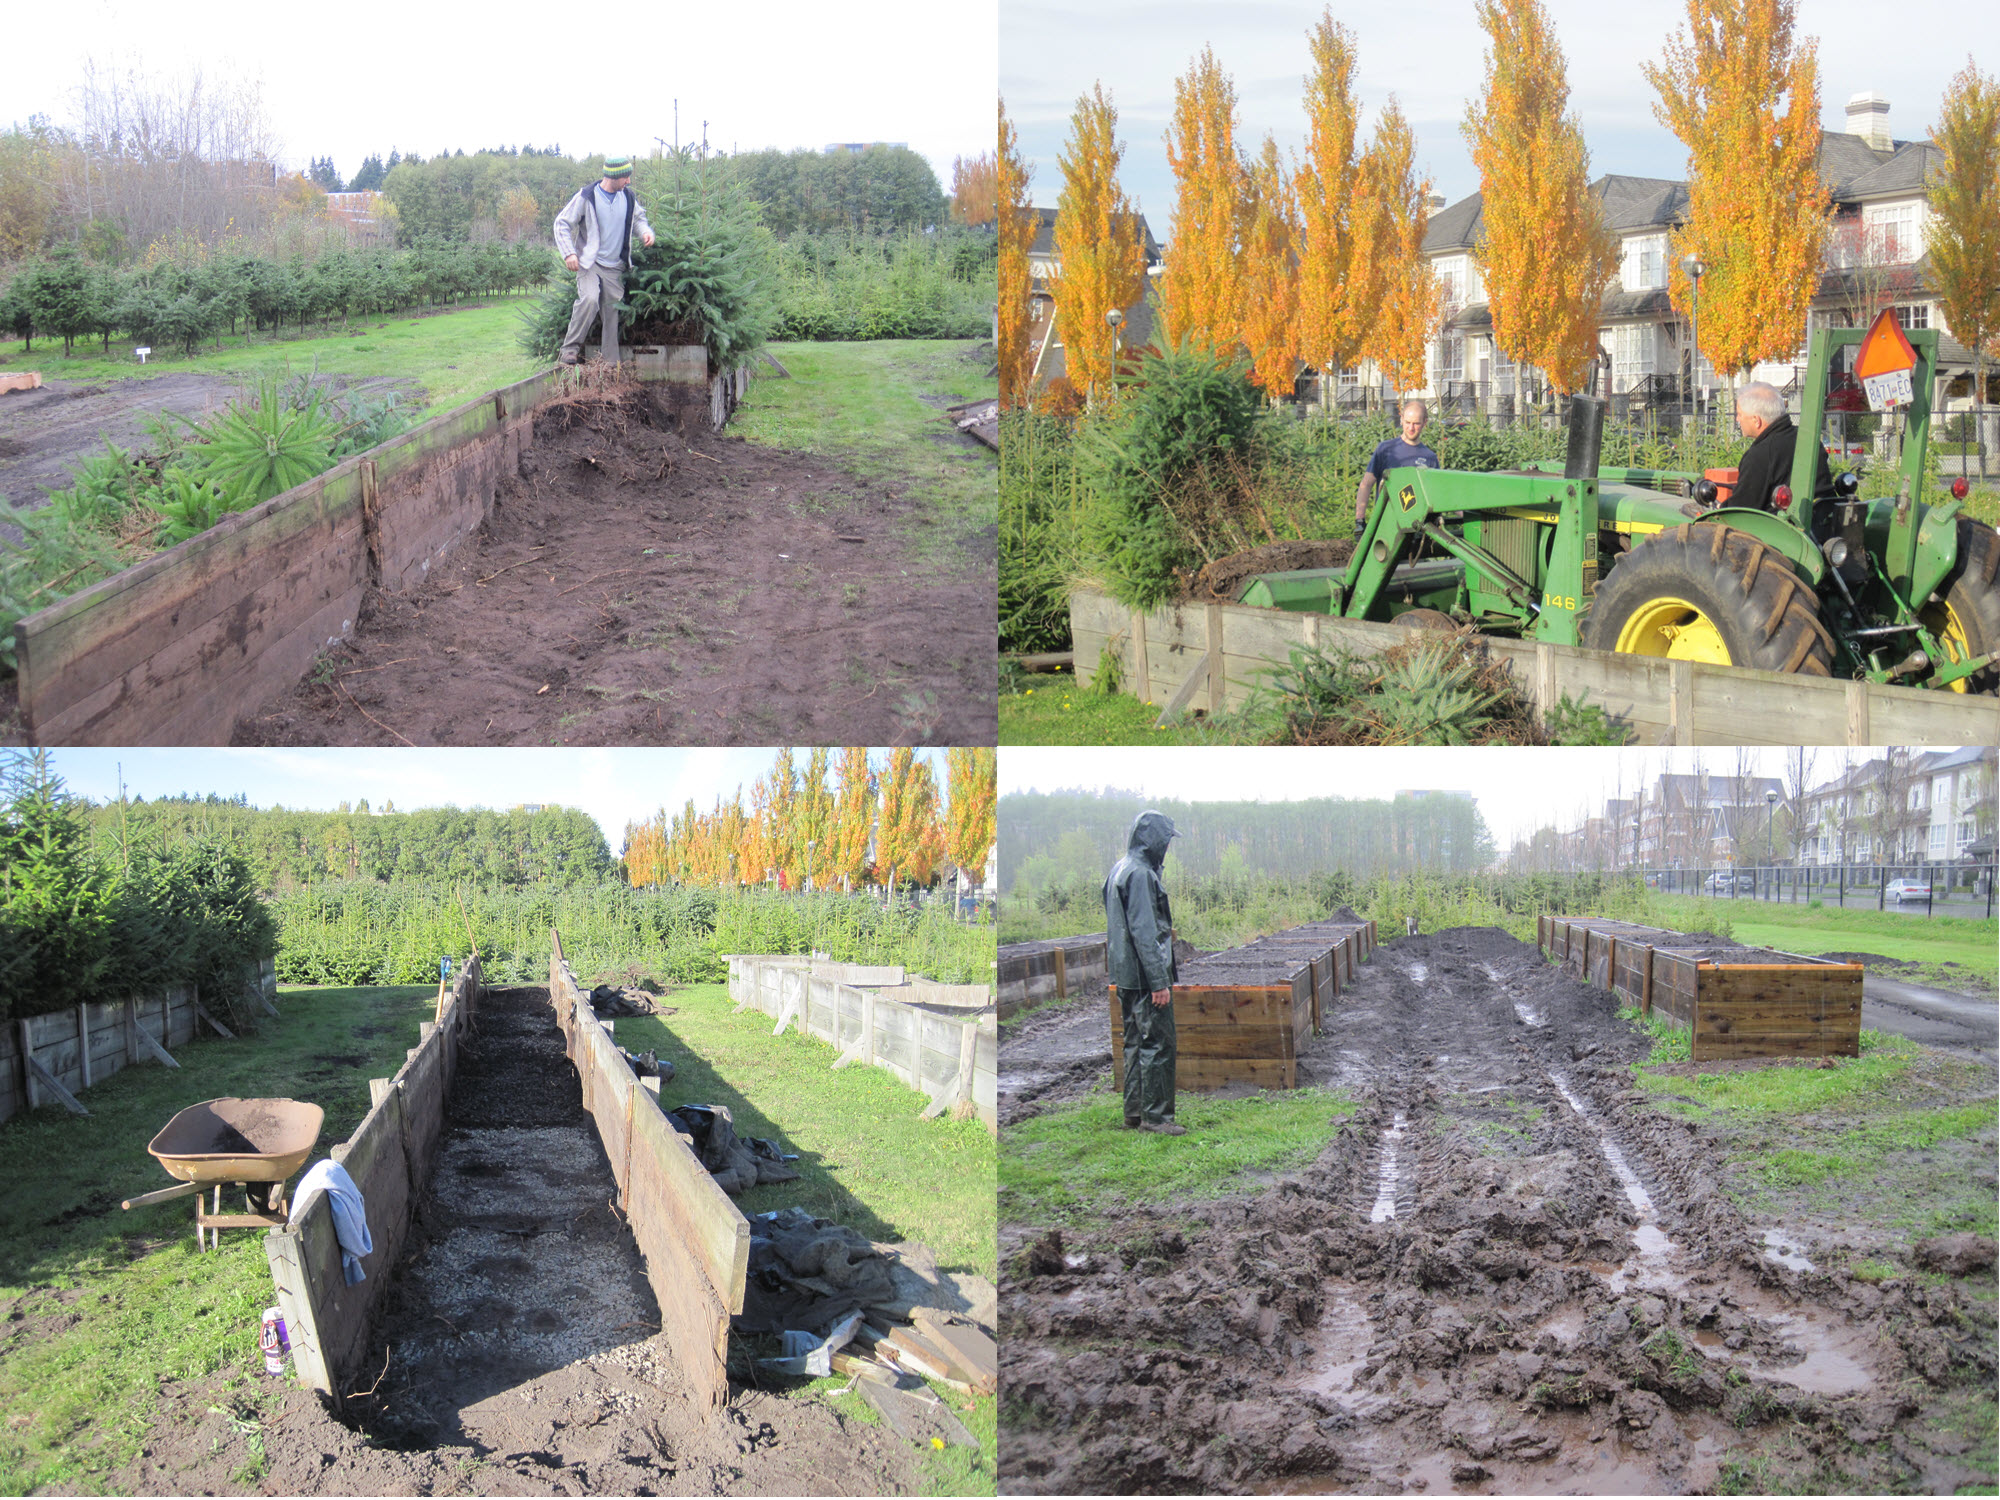
Fig. 6 : Re-building the beds …
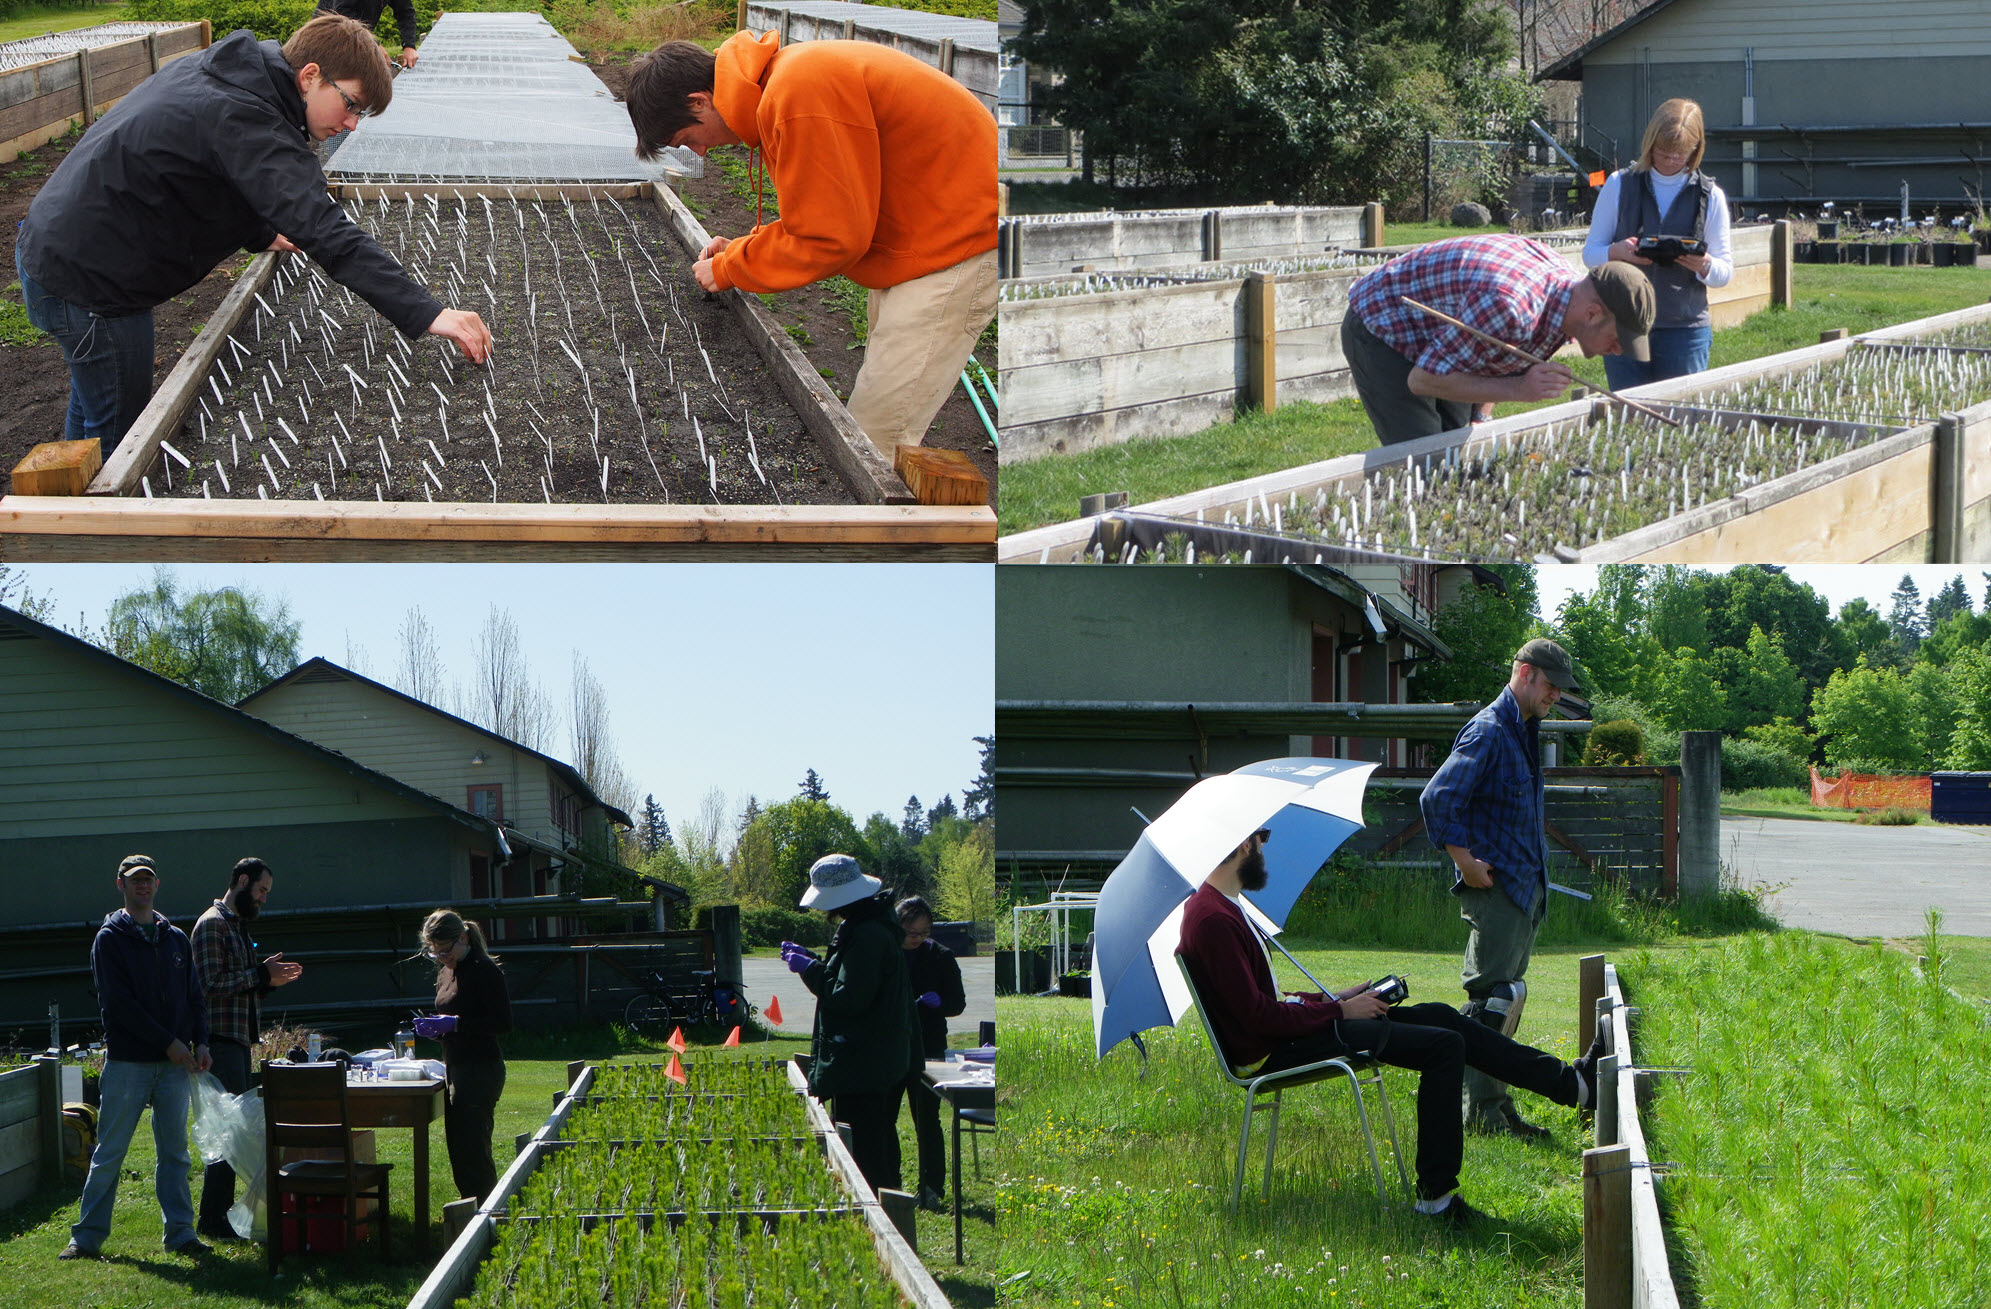
Fig. 7 : Sowing, observing, DNA collection, measuring, …
In August, I was privileged to attend a storytelling workshop with Denise Withers, as part of the genomics entrepreneurship program. Denise is convinced that every research proposal can be boiled down to a 3 minute sales pitch that your neighbor can understand, though it may take a lot of hard work. Denise spends her time coaching scientists and entrepreneurs to do just that.
These days, it isn’t enough to have excellent science in a proposal for funding or an evaluation report. Eventually, administrators and politicians also need to be convinced that we deserve to get a slice of their scarce financial resources. Research proposals increasingly need to demonstrate impact. This is some steps removed from direct project outputs, with all the risk and uncertainty involved, so scientists are understandably hesitant to ‘promise the moon’, while at the same time feeling the pressure to do just that. The funding agency may then appear be “playing Civilization”: starting at level 3 and investing 10 units in science should automatically result in reaching level 4. But real life is not like that, is it?
Science is characterized by the unexpected, so rather than a problem, this hurdle allows the characters to shine … if we tell the story well. Seeing the story in our research work requires zooming out from the detailed focus in which we spend our daily lives. Developing a logic model and a theory of change for the project are steps which can help us develop the overview. Doing it as a team may enhance mutual understanding of the various project activities, how they are connected, and any unstated assumptions. It can be built into the funding proposal to provide ongoing evaluation. And towards the projects’ end, we scientists turn into heroes having overcome insurmountable obstacles, to reach places where we perhaps didn’t expect to get to, and having changed the world just a little bit… And this, more than the 100 page report and the 10 papers, is what evaluators (and your neighbor) will remember. Although the 100 pages and the 10 papers are still needed.
Due to climate change, the seed sources being planted in our forest are becoming increasingly mismatched to the climates they will experience. This mismatch can be addressed by moving seed over the landscape where needed. This requires adjusting the rules of what can be planted where. However, we must first know which seed sources are best adapted to given sites, both now and in the future.
We reduced the scope of this problem to the two provinces of BC and AB and two important commercial species, interior spruce and lodgepole pine. However, we still can’t plant every seed source on every planting site and wait thirty years for the results. Instead, we looked at the underlying patterns of adaptation in the genome of these species.
Because of the enormous size of conifer genomes, we zoomed in on >25,000 candidate genes. These genes were then sequenced in 500 natural seedlots from all over to find genotypic variation at the base-pair level. The adaptive value was revealed by growing plants of the same seedlots in controlled environments simulating present and future climates.
We then developed a SNP chip to evaluate adaptive genetic potential in orchard seed lots, whose top quality seed is used by preference in tree planting. Using that, we can evaluate the ecological risks of moving seed sources over the landscape or ‘assisted migration’, including the status quo. This allows policy makers to update seed transfer guidelines as climate changes. A socio-economic research component ensures that stakeholders can make informed decisions regarding new strategies.
The main outcome of AdapTree is information about the adaptive potential of seed sources regarding present and near-future climates. The resulting impact, long-term, would be reduced plantation failures, increased forest productivity, and resilient forest-dependent communities. A short term outcome is the development of sampling and research methods that are transferable to other seed sources, species and climates.