The last big push – wrapping up the phenotyping for AdapTree
One last experiment of the AdapTree project remained in the ground: the trial comparing natural and seed orchard seed lots. The roughly 6000 plants were kept for a third season to collect periodic height measurements for the pine, and cold hardiness data for the spruce. The spruce trees announced themselves ready for freeze testing by the end of August, so September was dedicated to needle chopping and conductivity measurements. Thousands of them. Three whole weeks. Those who stuck it out were by then thinking with fond memories of the days gone by when the AdapTree team was large and fresh. But we did it, and the resulting data were clean.
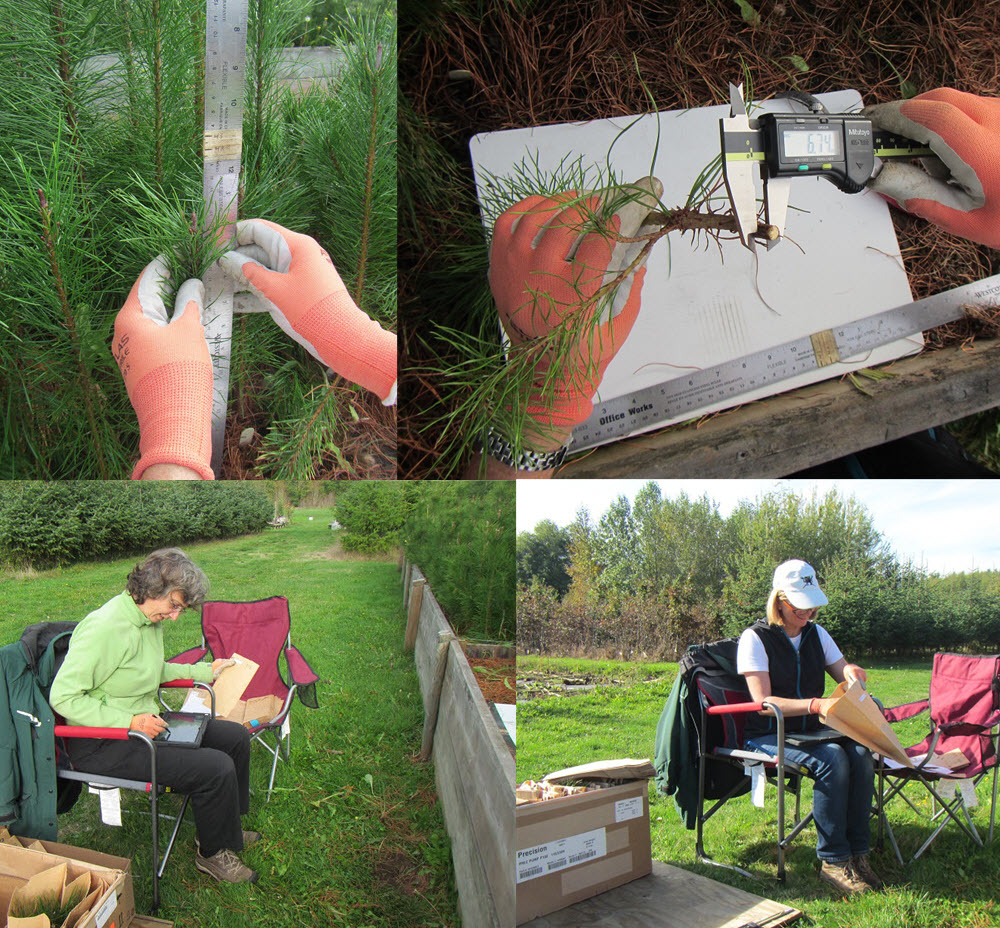
Fig. 1: Pine heights, diameters, data logging and harvesting for shoot dry mass
Nonetheless, it was the middle of October by the time we were performing the final height and diameter measurements on the pine, while simultaneously harvesting them for shoot dry weights. (Figure 1). Harvest time was preferred for diameter measurements because it gives us easy access to the stems. We had sun, we had fog, we had beautiful autumn days and we had rain. Now, we don’t exactly melt from a little rain. But shoving wet plants in wet paper bags which are marked with sticky labels of moderate stickiness is asking for trouble. And while the recording tablets are protected, raindrops beading on a screen are not ideal for visibility. So this became a long, drawn-out affair. Of course, we only take pictures on the nicest days!
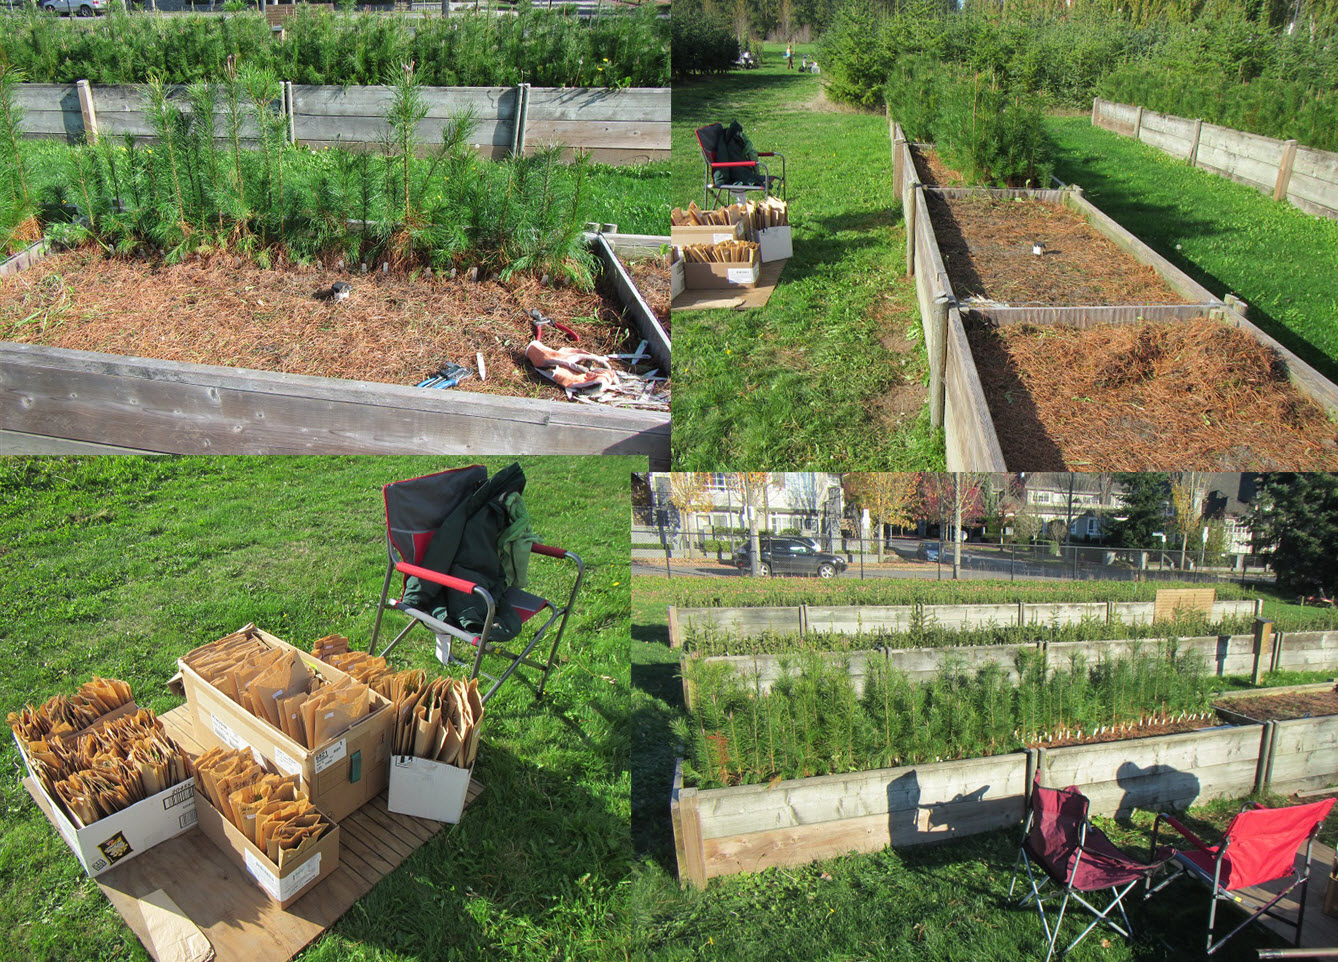
Fig. 2: Gradual progress
The ideal team consisted of three people, so we organized our schedules, waited for the rain to stop, and gradually made progress (Figure 2). We finished the pine and thought we’d just continue at the same speed with the spruce. (Figure 3). Not so. While the spruce plants were much smaller than the pine, the stems were thick and asymmetric, with multiple roots spreading horizontally almost before touching the ground. Individual diameter measurements were not very repeatable, so multiple measurements were taken. Rather than taking turns at measuring, recording and bagging, for consistency’s sake all twelve blocks were measured by the same person. The repetitive bending over proved fatiguing.
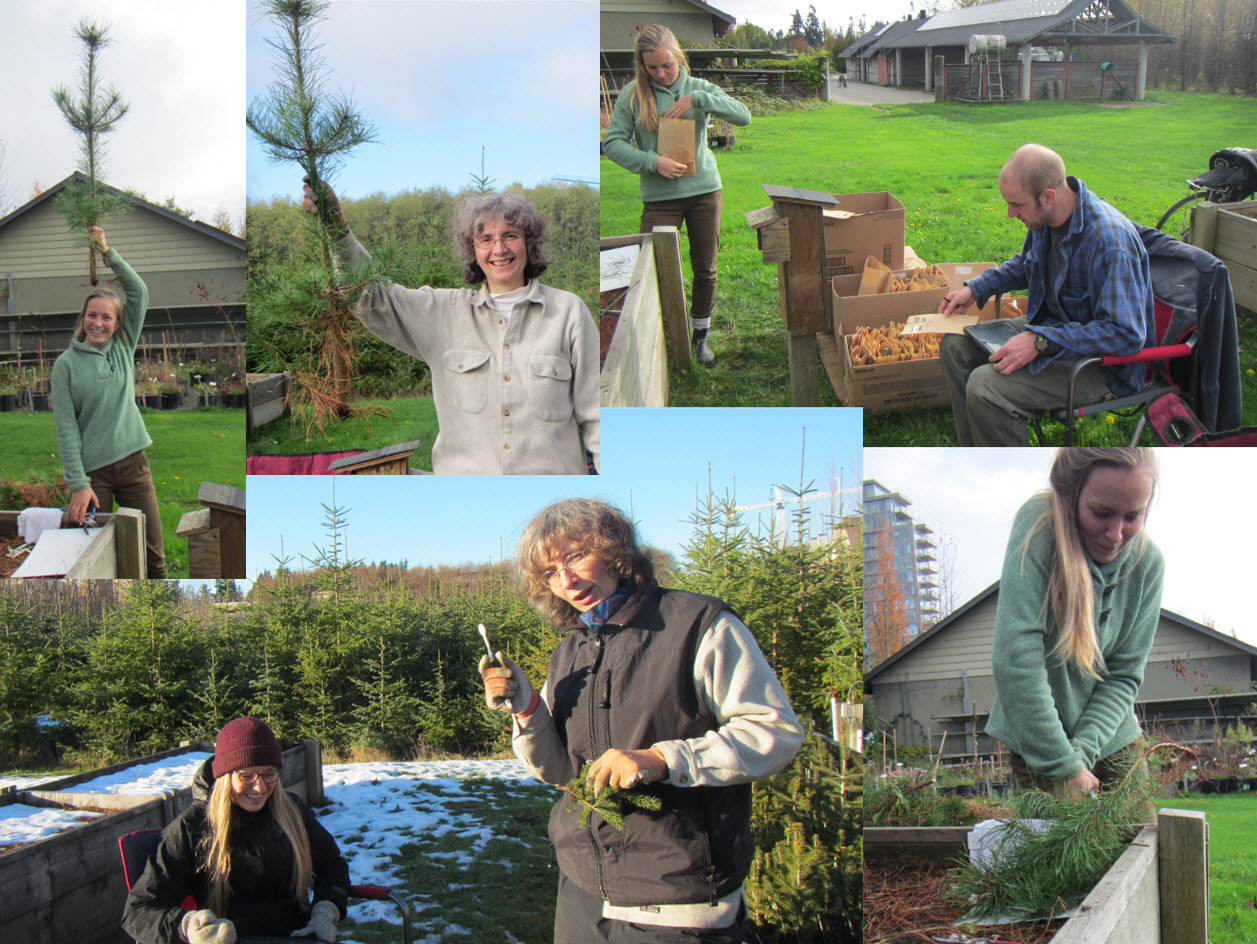
Fig. 3 : Some large pine, and the first snowfall
If you wonder what I am holding up: it’s an old toothbrush, to clean the root collar of sand and mud before taking a diameter measurement.
Then we had frost and snow in November! And the frozen ground in combination with the frozen liverworts and moss did not make a good basis for reliable height measurements – who’d have thought frozen bryophytes could bring science to a halt? As the days got shorter and shorter, we completed the heights separately.
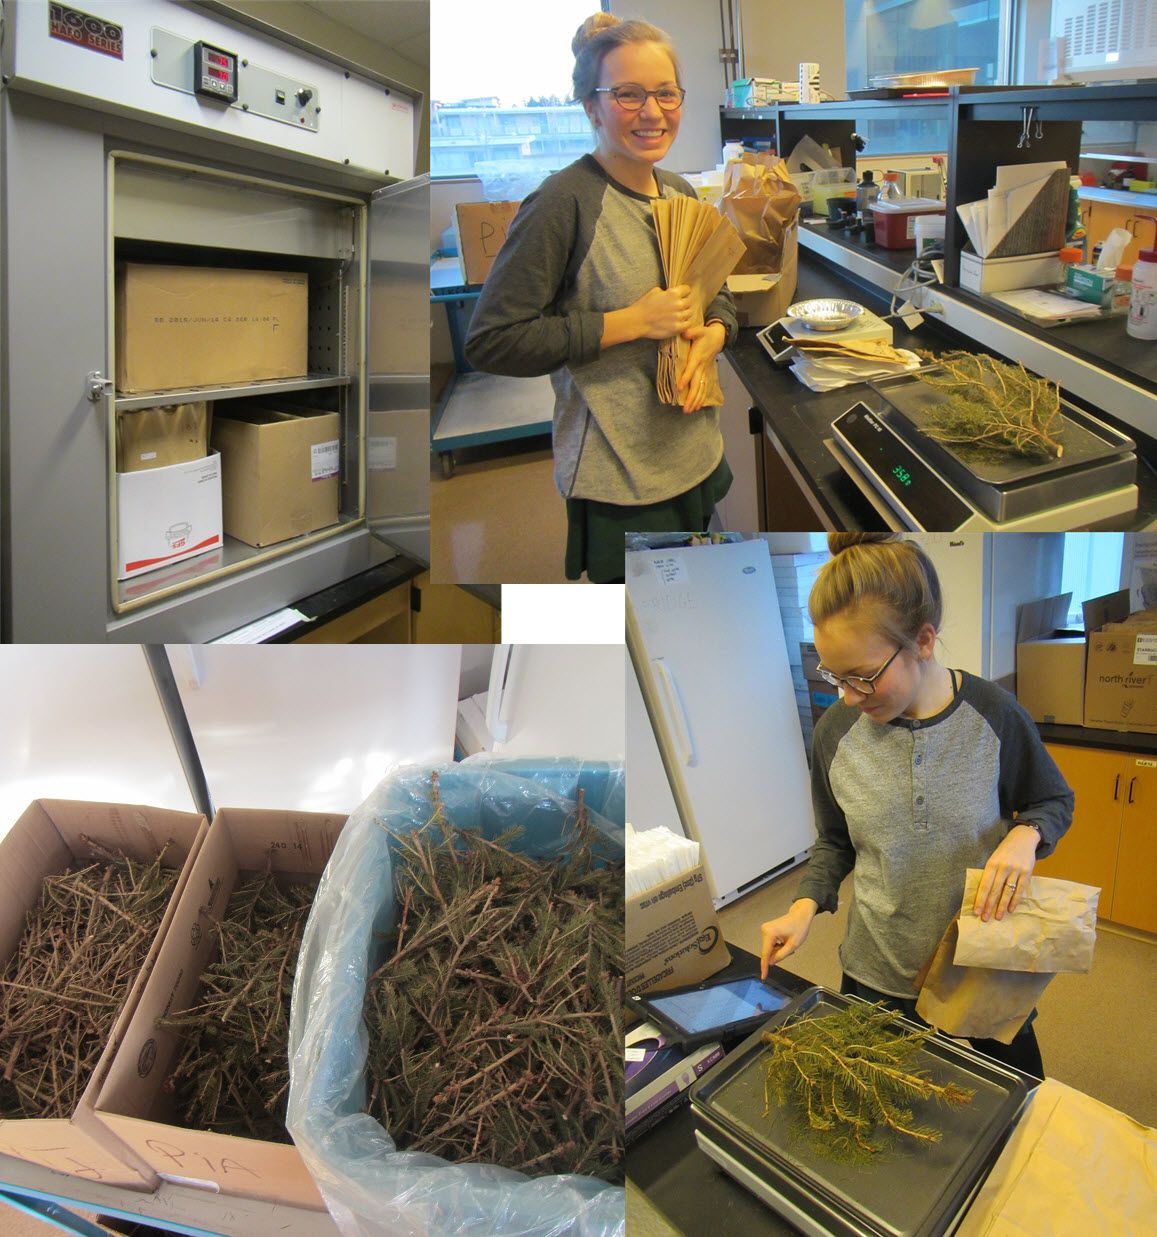
Fig. 4: Dry weights – so many!
In the meantime, shoot dry weights were measured in the lab, to keep the accumulating boxes of dried plants under control. (Figure 4). We didn’t finish before Christmas as planned, and Ian had to wait and wait for his data. With mild weather in the first week of January, we made one last big push, and the last spruce tree was cut on January 9 (Figure 5), with the last dry weights gathered two weeks later.
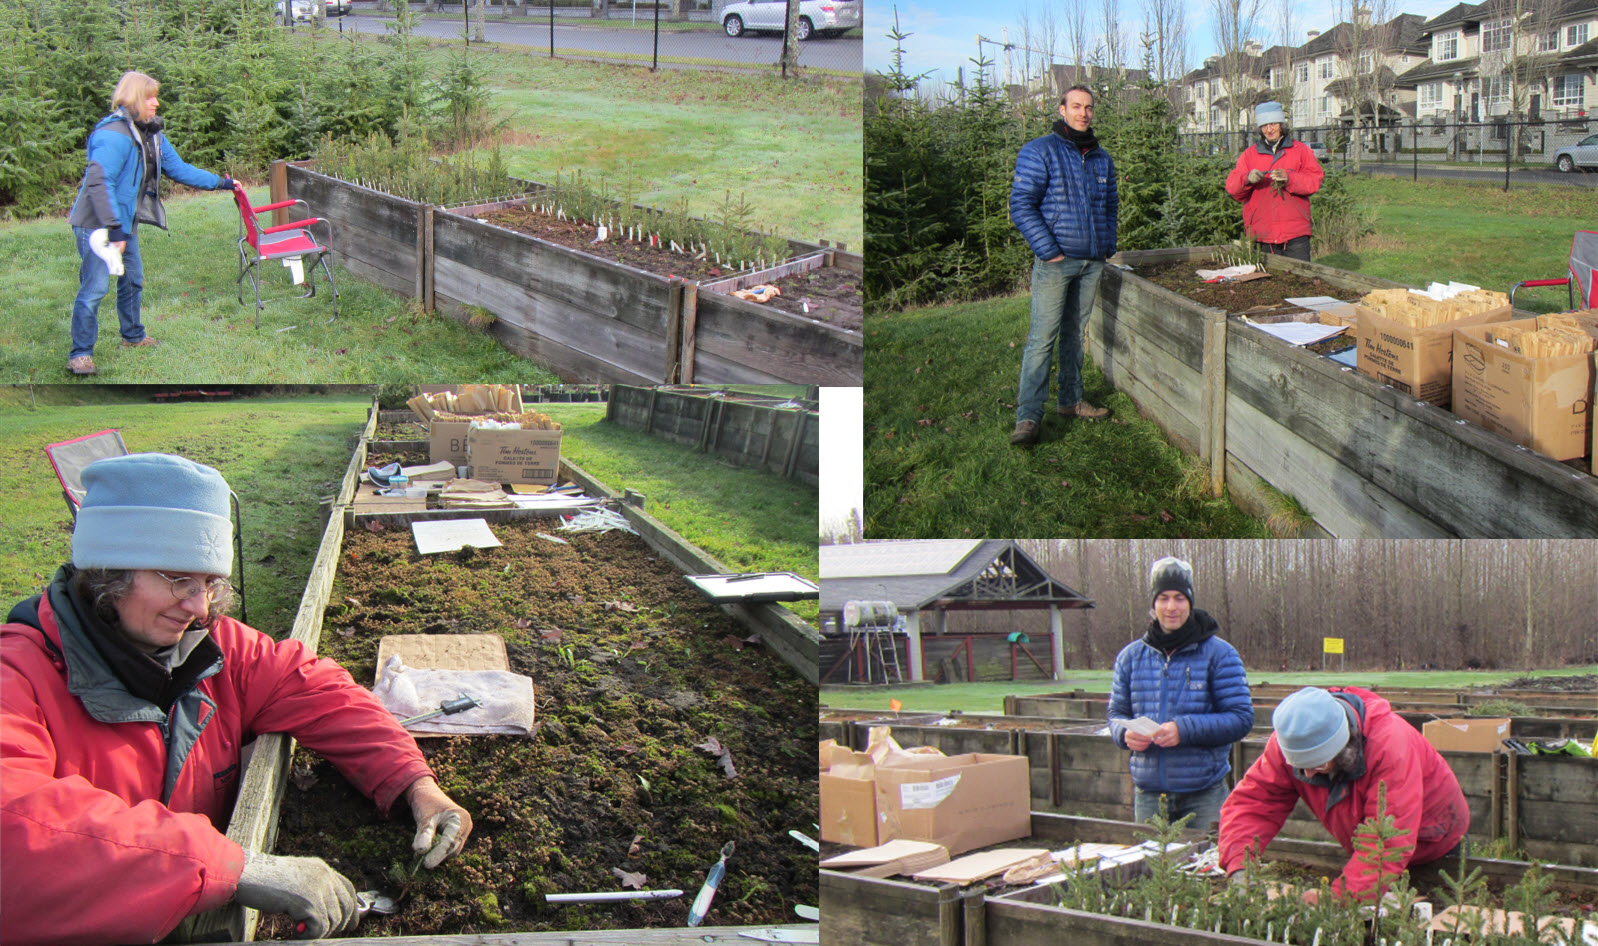
Fig. 5 : The last spruce tree is cut …
And now all the plants are gone and no more measurements can possibly be collected from them!!!
I am grateful to all those who helped out (you can see some of them in the pictures!), and for the hot tub in the swimming pool. Did I mention the guys who (re)built the raised beds in the first place (Figure 6) ? And the summer students who helped sowing, and the technicians and students who collected weekly height measurements (Figure 7) ?
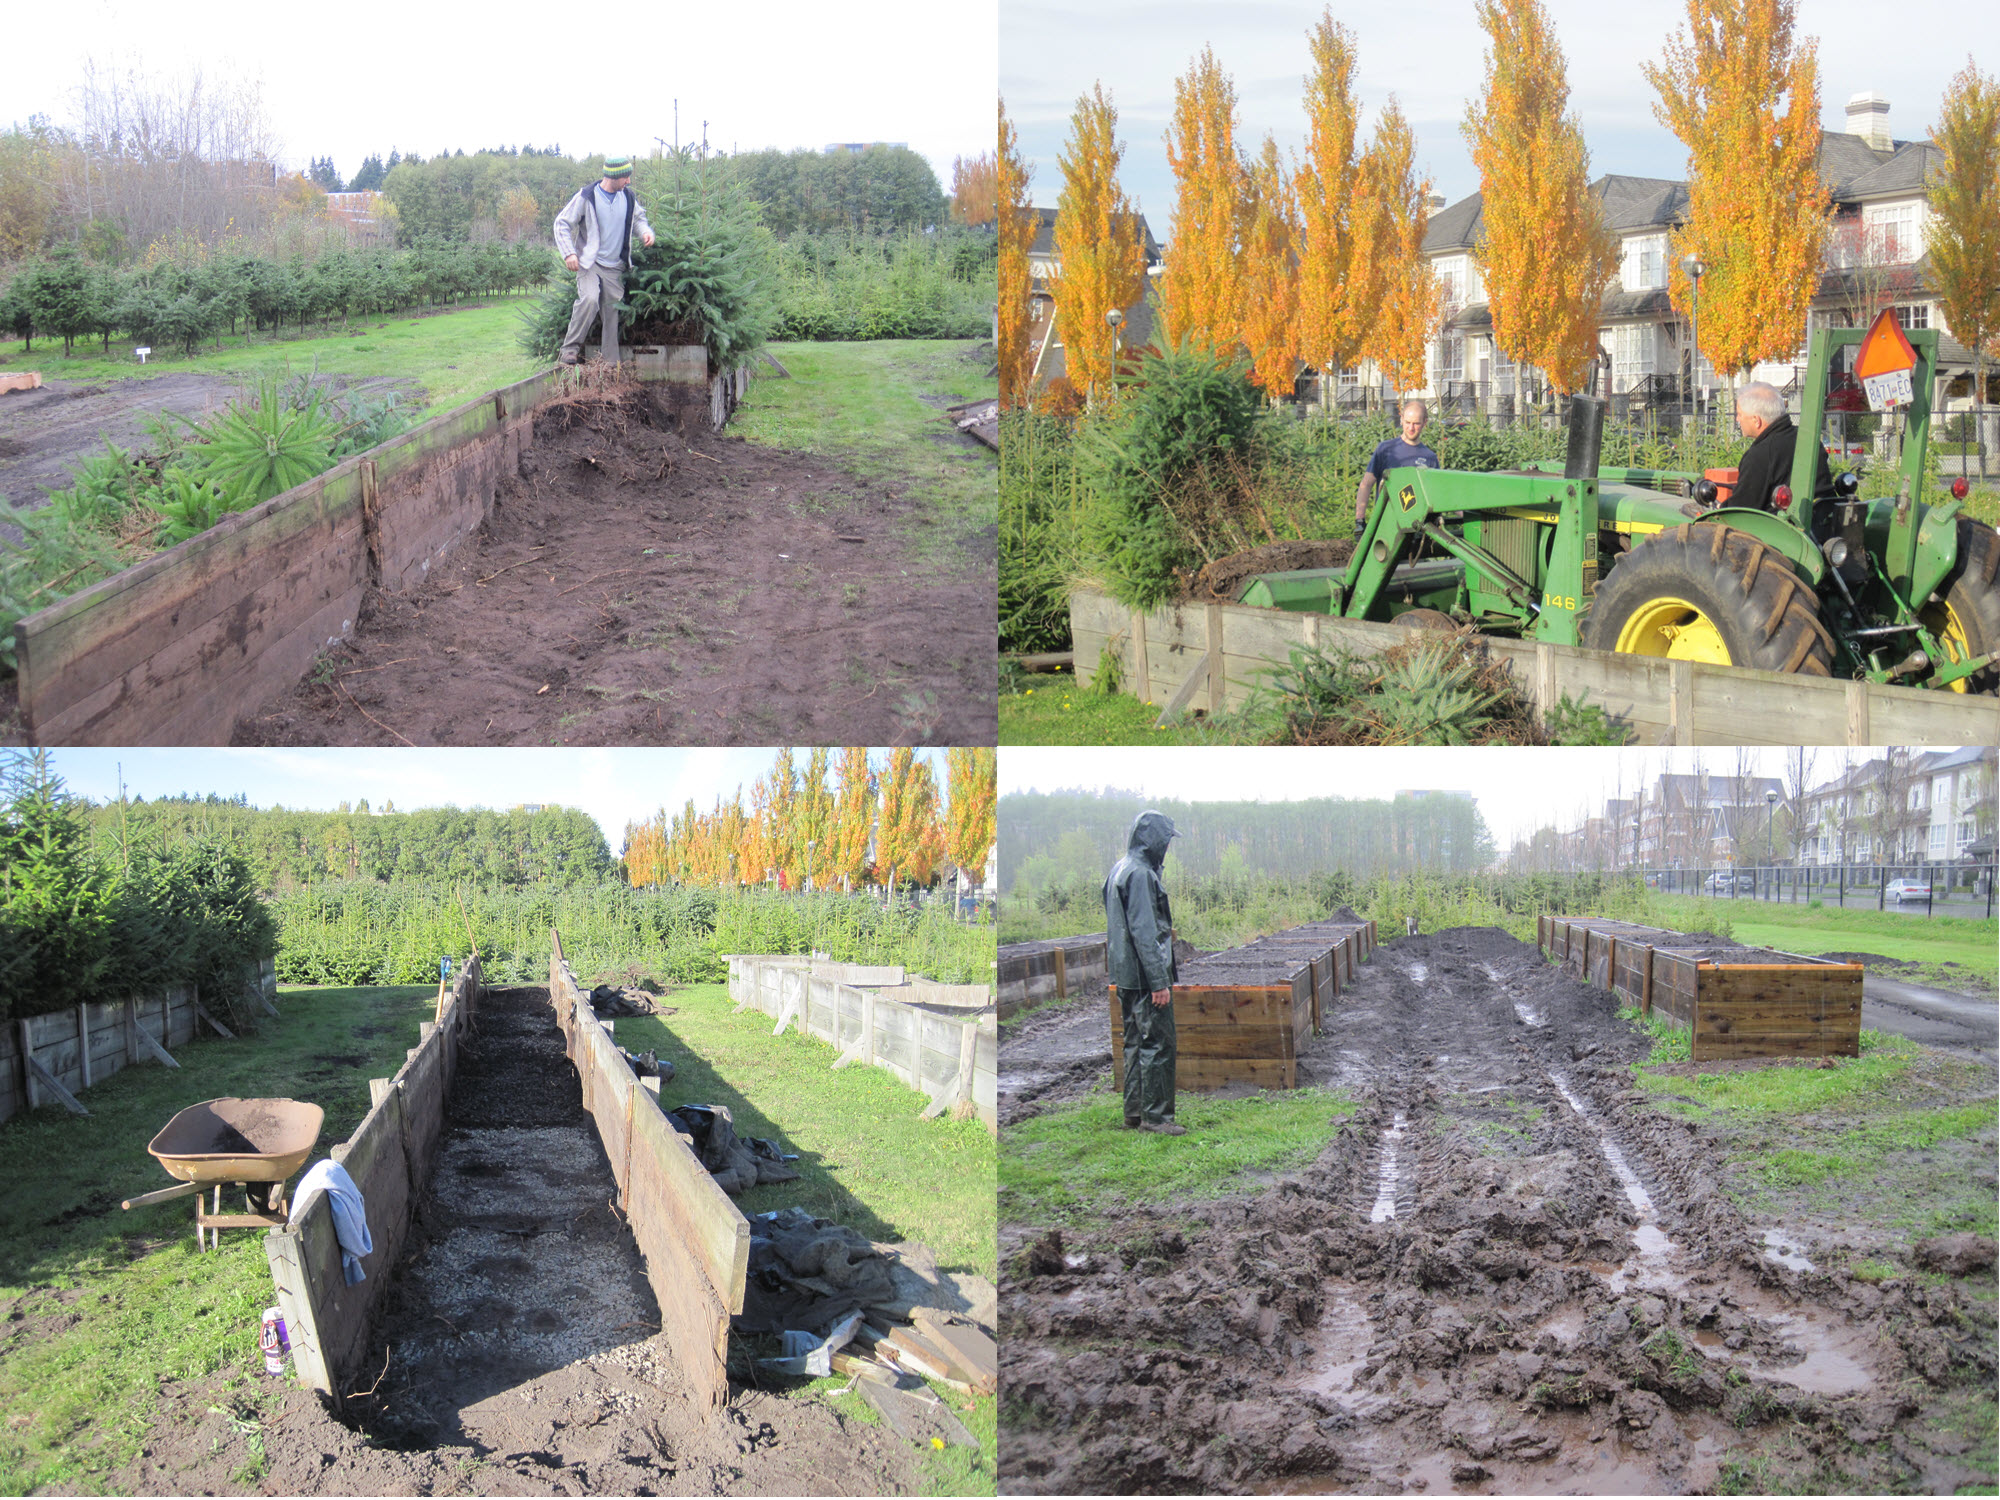
Fig. 6 : Re-building the beds …
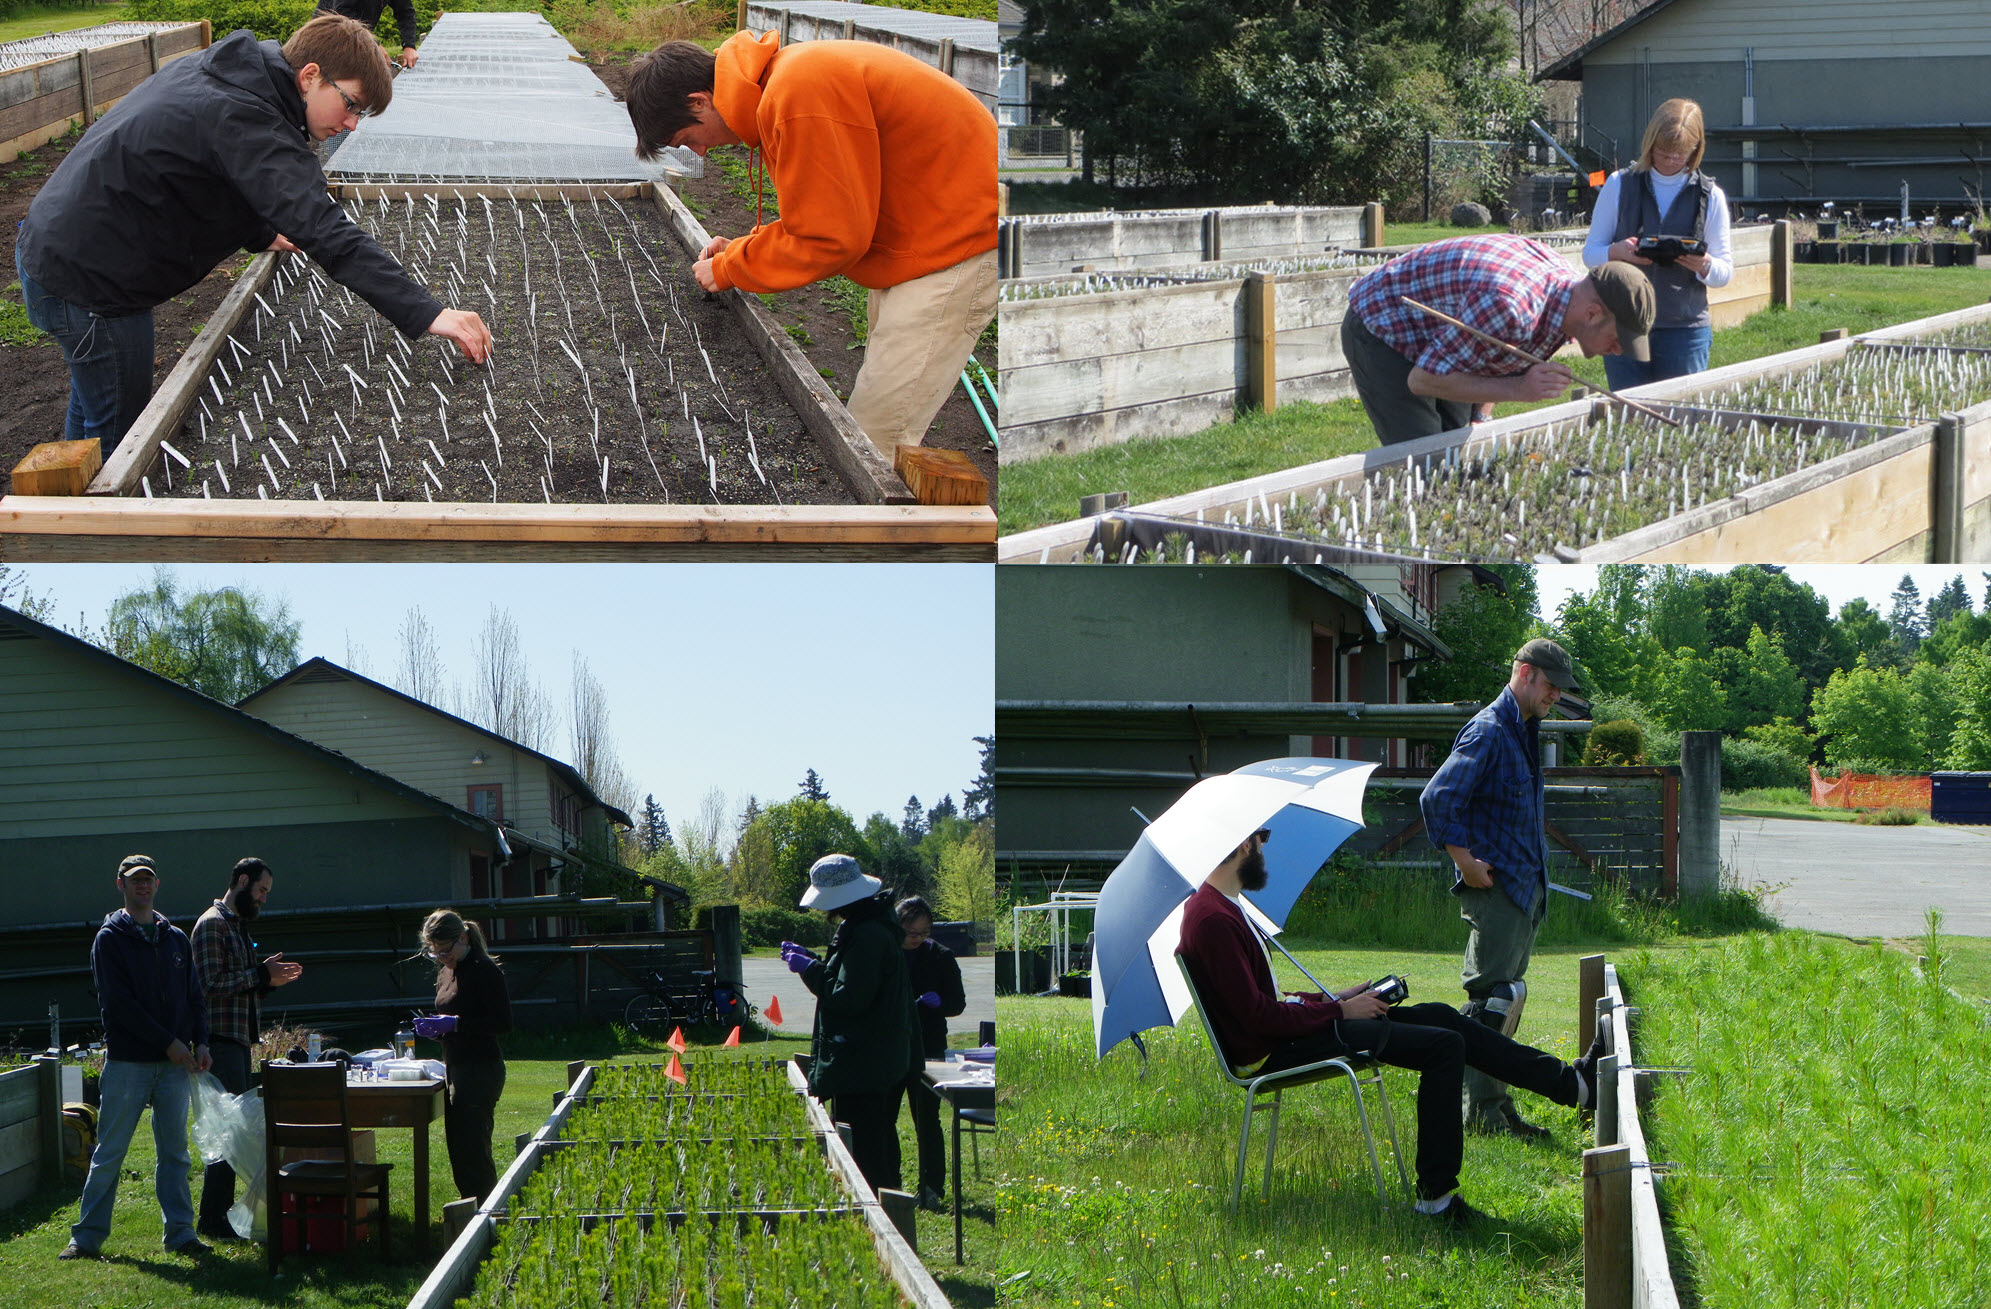
Fig. 7 : Sowing, observing, DNA collection, measuring, …