It’s time to say goodbye

This is the last week of our trading game, so it is the time for us to say goodbye.

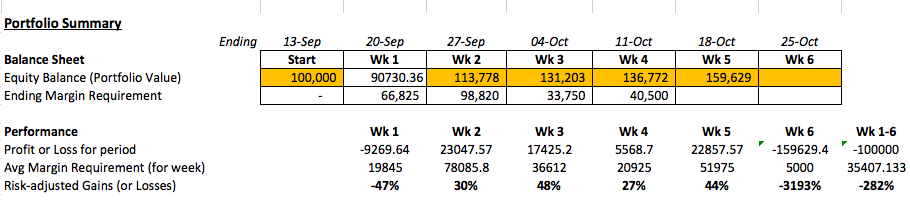
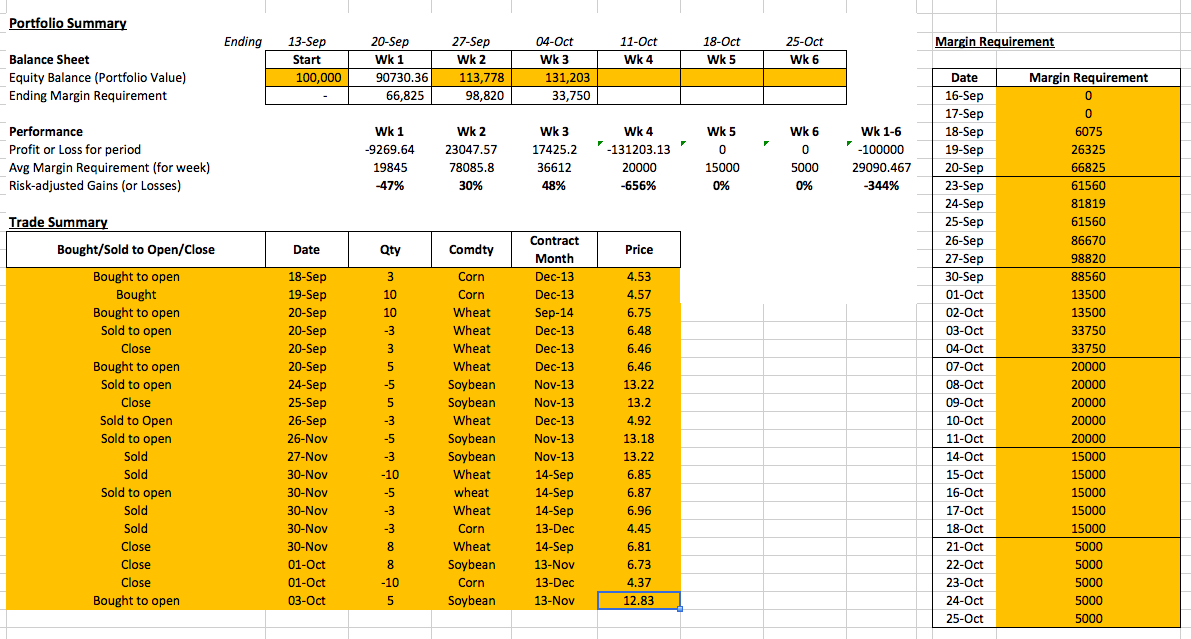
My portfolio value at the ending of this week is $159,506.51. The overall return is 59.51%. It is much higher than the interest of the government bonds and the return of mutual funds. Thus, I guess that my performance is not bad.

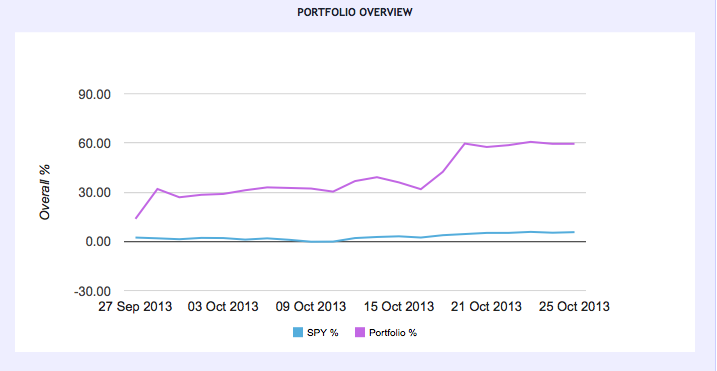
What I learnt from trading game

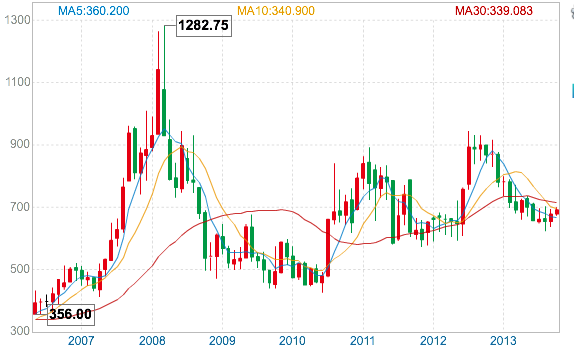
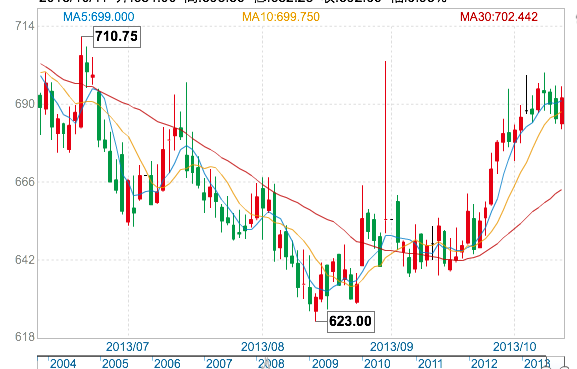
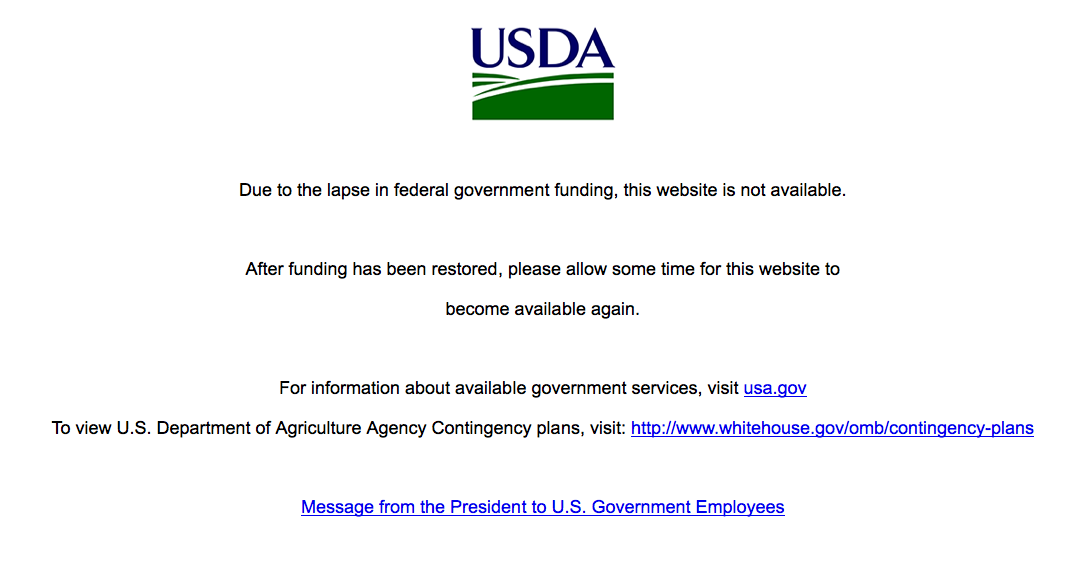
Reading finance news and the reports from USDA are important. In the first week of the trading game, I read the news and knew that China had huge demand of importing wheat. Therefore, I decided to long the wheat. During these six weeks, the price of wheat has spiked a lot, so more than half of my return was contributed by wheat. In addition, from USDA’s report, I knew that the projected yield of soybean in this year is relatively high, compared to the history data. I shorted the soybean and get almost $19,000 return.

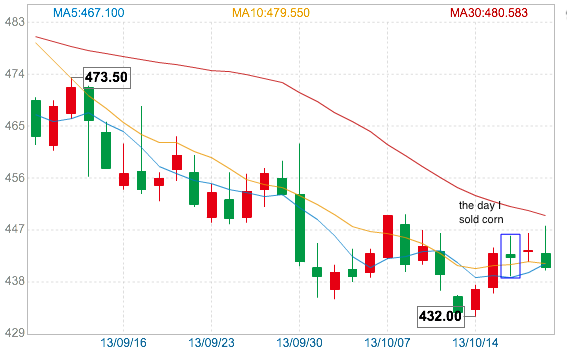
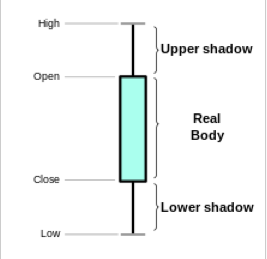
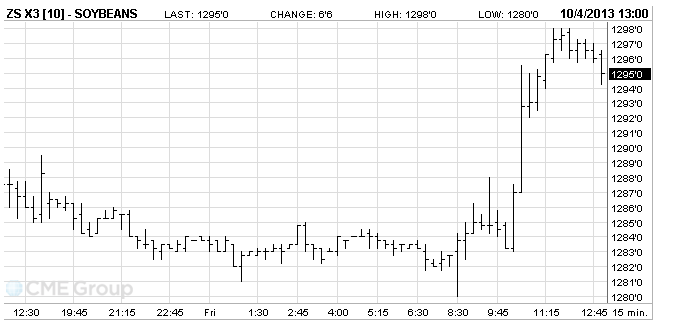
Understanding how to do the technical analysis is really helpful.During these weeks, I learnt a little bit knowledge about how to analyze the market based on candlestick chart. This helps me to decide when is the best time to long or to short certain commodities. Because of this technical analysis, I could long commodities at relatively low prices and short them at relatively high prices.

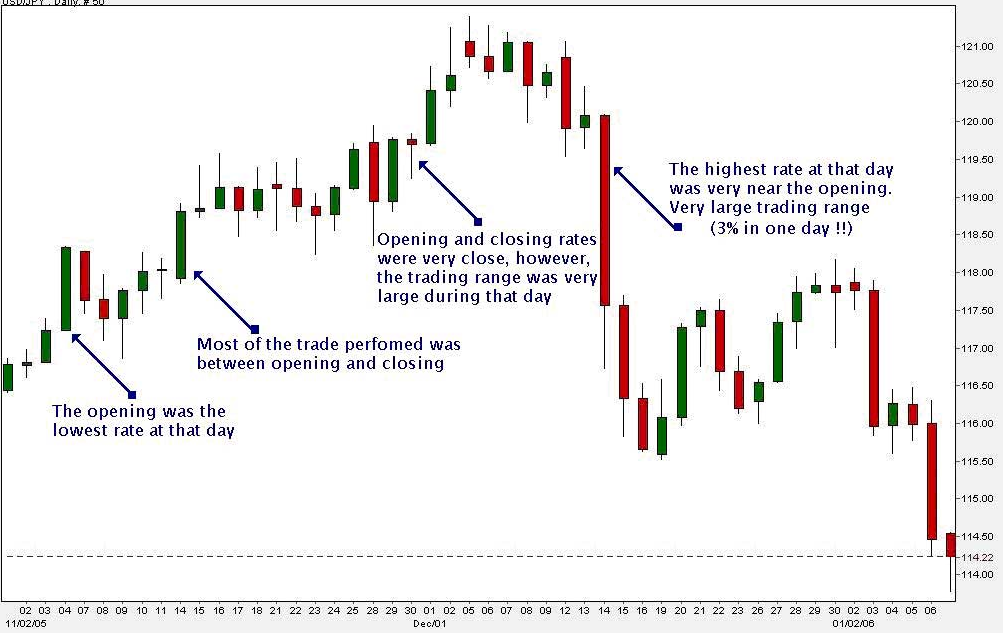
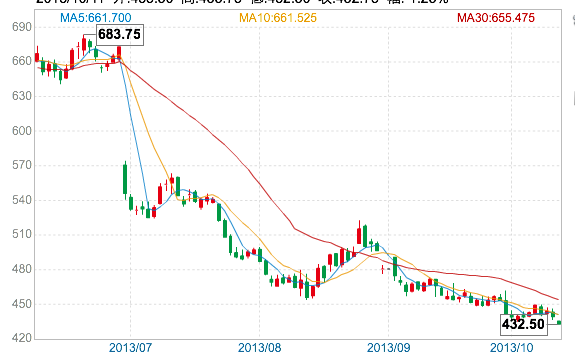
Ration is a virtue of making the trading decision. I lose $11,075 on my corn future. There are several reasons that can explain this huge loss. First, before I longed corn, I never did any research and analysis, so I made a decision impulsively. Secondly, I always wanted to get more profits, even though I knew it was not a good time to hold the corn after I did the research. Thus, I missed many opportunities to sell it at a good price. Furthermore, I was afraid of suffering more loss so that I sold my corn at really low price, although I felt the price would rebound a little bit after its price collapsed. It is important that a good trader should be rational.

Hedge is a good way to reduce the risk? I put a question mark on this, because I am not sure whether the investors with limited money can reduce their investing risk through hedge or not. As an investor with limited money, his/her return is limited as well. At the same time, hedge will decrease their limited return further; sometimes it even causes negative return in reality. Theoretically, hedge may be a good strategy to reduce price risk. In practical, I doubt that.

I don’t have much to say for this week’s blog. This is a terrible week for me. My life is kind of messed up. To be honest, I can’t concentrate on doing anything. I hope I will have a better week next week.

So, good luck for me.

Candlestick Chart II

Portfolio Summary of Week Five:During this week, I made a few trades for corn and wheat. I am kind of addictive in candlestick chart, so the most decisions I made is based on it.

Corn

After the corn reached the lowest point of three years on last Friday, the price of corn rebounded a little this week. I longed 10 units of corn on Monday, and sold them on Wednesday.

The candlestick chart on Wednesday is called spinning top. The characteristic of spinning top is that both upper shadow and lower shadow are relatively long and the body is relative small. It means indecision. The small body indicates that the difference between the open price and the close price of corn on Wednesday was little. The two long shadows represent that both sellers and buyers were relatively active during this day, but neither buyers nor sellers can dominate the trade.  This spinning top of corn appeared after a long advance candlestick on Tuesday. It shows that the advantage of buyers may be limited and the increasing trend of corn price may change. Thus, I sold all my corn this day.

Wheat

During the early days of this week, the price of wheat retraced, but the price continuously increased on Thursday and Friday. I longed 10 units wheat on Wednesday, so I had 25 units wheat in total. On the Friday morning, I sold 10 units wheat.

Below are the reasons to explain the decisions I made.

The candlestick chart of wheat

The candlestick chart of wheat on Wednesday has a long lower shadow. The long shadow means that most of trades are made during the day rather than near the open and close. The long lower shadows and short upper shadows represent that the sellers dominated the trades on Wednesday and drove the price of wheat decreasing. The buyers, however, showed strong interests in longing the wheat and bid prices higher by the end of the day. Thus, the close price was relatively strong.

The candlestick chart of Friday day is also very interesting. The body of candlestick is quite long which means that the price difference between open and close is large and the buyers are aggressive to long the wheat and control the trade.

The line chart of wheat on FridayFrom the chart, it is easy to find that the price of wheat dramatically increased in the early morning of Friday. I don’t really understand why this happened and the only commodity in my hand was wheat, so I sold 10 units wheat to reduce the risk. (I still remember the situation happened half month ago. The prices of agriculture commodities increased dramatically before the stock announcement of USDA on September 30. After this unanticipated announcement, the price of corn and soybean went down rapidly.)

Highlight Events of this Week

The USDA Re-Opened This means that the traders can get accurate reports and the volume of trade will increase. On next Monday, USDA will announce the US crop progress. On next Tuesday, it will announce the wheat data, which is really important for my wheat trading.

Wheat Prices Rise to 4-Month-High On Friday wheat price rose to the highest level since June. The reason is that the Argentina, the second-largest producer of wheat in the Southern Hemisphere, forecasts 8.8 million metric tons of wheat production for the 2013-2014 harvests. This is significantly lower than the forecast of USDA in September, which is 12 million metric tons. In addition, Russia may lose 4 million metric tons of wheat next year because rains restricted planting of winter crops. Please see Russia May Lose 4 Million Tons of Wheat as Rains Hamper Planting.

China GDP hits 7.8% The National Bureau of Statistics of China announced that the world’s second-largest economy grew 7.8% (faster than expected) during the third quarter of the year.

P.S. The news of economy growth of China is an important reason to explain that the prices of November crude oil rose 14 cents, or 0.1 percent, to $100.81 a barrel on Friday. Since crude oil functions as the benchmark of the commodity market, the GDP growth of China might be a good news for the traders of agriculture commodity whose trade is long-position.

Good luck ~

Why I did not do trades this week

There are several reasons to explain why I did not do trades this week.

Reason No.1: USDA is still closing. As an outsider of the market, it seems really hard to make decision of trade in the future market without any official information or data. Although there are many news (or we can call these as rumors) in the market, but it is difficult to recognize which is the truth. If we believe fake news, we will make wrong decision and suffer huge loss. Thus, I feel that becoming a market watcher may be a safe decision to avoid loss.

Reason No.2: After analyzing the candlestick graph, I found that the market is full of uncertainties, especially to soybeans.

This is the picture to explain the meanings of candlestick:

The red candlestick means price increasing at that day; the green candlestick means the price decreasing at that day.

The daily candlestick chart of corn:

The candlestick chart of corn shows that the price trend is going down and the trading volume is relatively small. This means that the price of corn would not fluctuate a lot in the short run and the market seems to be not really interested in corn, if there is no unanticipated news or announcement. Therefore, it is a little bit hard to make profits since the time is the most scarcity resource of a master student.


The monthly candlestick chart of wheat

From this chart of wheat, both peak and trough of the price cycle are higher than the previous one. This indicates that the price trend of wheat is going up. In addition, the price of wheat is near the trough, so it might be a good time to long wheat and held it in the long term.

The daily candlestick chart of wheat

This chart shows that the upper shadows of wheat are relatively long. It means that the daily price fluctuation of wheat is relatively wide, but the closing price is much lower than the highest price of the same day. Thus, the climbing space of the wheat price may be limited in the short run. In other words, the price of wheat may roll back. The lower shadow of wheat, however, is also relatively long. This shows that the price of wheat will not roll back a lot. Therefore, when the price rolls back, it might be a good time to long the wheat.

The daily candlestick chart of soybean

The candlestick chart of soybean is quite similar to the chart of corn. The major difference of these two charts is that there is obvious peak and trough in this graph.

Thus, it is kind of hard for me (the new comer of the market) to predict the price trend of soybean in the short run. The price of soybean might go down or might be rebound.

Reason No.3: There were so many due days this week. This is the most important reason to explain why I did not do many trades this week. I feel so exhausted.


Highlight Events of this Week:

The Corn Futures fall to Three-Year Low On Friday, the price of corn future falls to the lowest point for the last three-years; the price of soybean went down the most this month. There are two reasons to explain why this happened. Firstly, as the largest producer of corn and soybean, the US is harvesting much more soybeans and corns than expected. The supply of corn and soybean increases dramatically. Another reason is that the market expects that the US government may amend a biofuel mandate, because the current mandate may exceed refiners’ ability to blend ethanol into fuel. If this is the truth, the demand of corn may decrease.

PS: I am not sure whether these reasons will cause the prices of corn and soybean to continuously decrease. Because the US government is still shutting down, we lack of accurate information to judge the authenticity of the news. The market is always full of rumors. In addition, China shows strong interests to import more soybeans and corns. The quantities of import from China may be another important determinant of the price trend of corn and soybean.

I hope that I have more time to watch the market in the next week, but probably not. The midterm weeks are coming.

Happy Thanksgiving Day.

Bye-Bye, Corn

Portfolio Summary of Week One:

Finally, I sold all my corn. The total lost of my corn future is $11,075. I, however, learnt a lot. Yes, I have to say thank corn, although you let me lose so much money. (It is not real money, but I still feel disappointed^_^).

The lesson I leant from this tragic trade:

Be Fearful When Others Are Greedy and Greedy When Others Are Fearful. This is a famous saying from Warren Buffett. The saying is really easy to understand, but it is hard to be practiced. Because I am the newbie of the market, I cannot be so rational. I missed many opportunities to sell the corn at a better price. I always want to get more profit, even though I know it is not a good time to hold the corn. (Do I look like a gambler?) Also, I am afraid of suffering more loss so that I sold my corn at really low price, although I felt the price would rebound a little bit after its price collapsed on Monday. (Do I look like a coward?) Greed and fear can explain the reason of my huge loss on corn future.

The reflection of other things I did from this week:

You do things when the opportunities come along. I’ve had periods in my life when I’ve had a bundle of ideas come along, and I’ve had long dry spells. If I get an idea next week, I’ll do something. If not, I won’t do a damn thing. This is another saying from Warren Buffett. It can conclude other transactions that I did this week. After the prices collapsed on Monday, I covered all my short position corn and soybean futures that night because I had no idea what would happen in the following days. Although it was not the best price of the week, as a risk adverse, I thought that covering the contract and holding cash might be good decisions after price dramatically went down. On Thursday morning, I bought 5 units soybeans and hoped to sell it when the price rebounds. I probably have to set up a stop price since midterm week is coming (so many due days!!!) and I will not have enough time to watch the market.

Highlight Events of this Week:

Here comes the most boring part of my blog — news announcement.

The News of Corn, Wheat, and Soybean After the USDA announced that the stock of US corn and soybean are much more than market expected, the price of corn and soybean collapsed simultaneously on Monday. This, however, only influenced market in two days. The price of corn and soybean rebound since Wednesday. The news “Soybeans Rise as Informa Cuts U.S. Crop Forecast; Corn Advances” explain the reasons that soybean futures rose from Wednesday to Friday.

I found another news, “Commodities Market Impact Weather 10/04: Wet and Chilly Weekend”, that might be helpful for my trading decision of next week. Weather, as one of the most important variables of commodity market, undoubtedly influences decision-making. Rain in the soybean production areas may delay the harvest. It expects that the price of soybean future will rise, at least in a short term.

The US Government Shut Down The US government closed its doors on Tuesday because Congress could not reach a deal on a temporary spending budget bill. This is not the only fiscal crisis looming for the US economy. The debt ceiling is another and more serious issue of the economy. Because the US federal government has never defaulted before, it is hard to accurately predict how severe long debate over debt ceiling will effect the recover of the US economy.

PS: How can this event influence the agriculture commodity market? After the US government shut down, the USDA turned off its website and stopped to announce any agricultural data. The traders of future market have no way to access any official data of the US agriculture. The trading volumes of future market may decline because of lack of information and asymmetry of information.

Next week, I plan to watch other commodities, like milk or cattle (if I have more time). I am a little bit tired of watching wheat, corn, and soybean.