Planning For a Tsunami
Total area that is under danger in the City of Vancouver
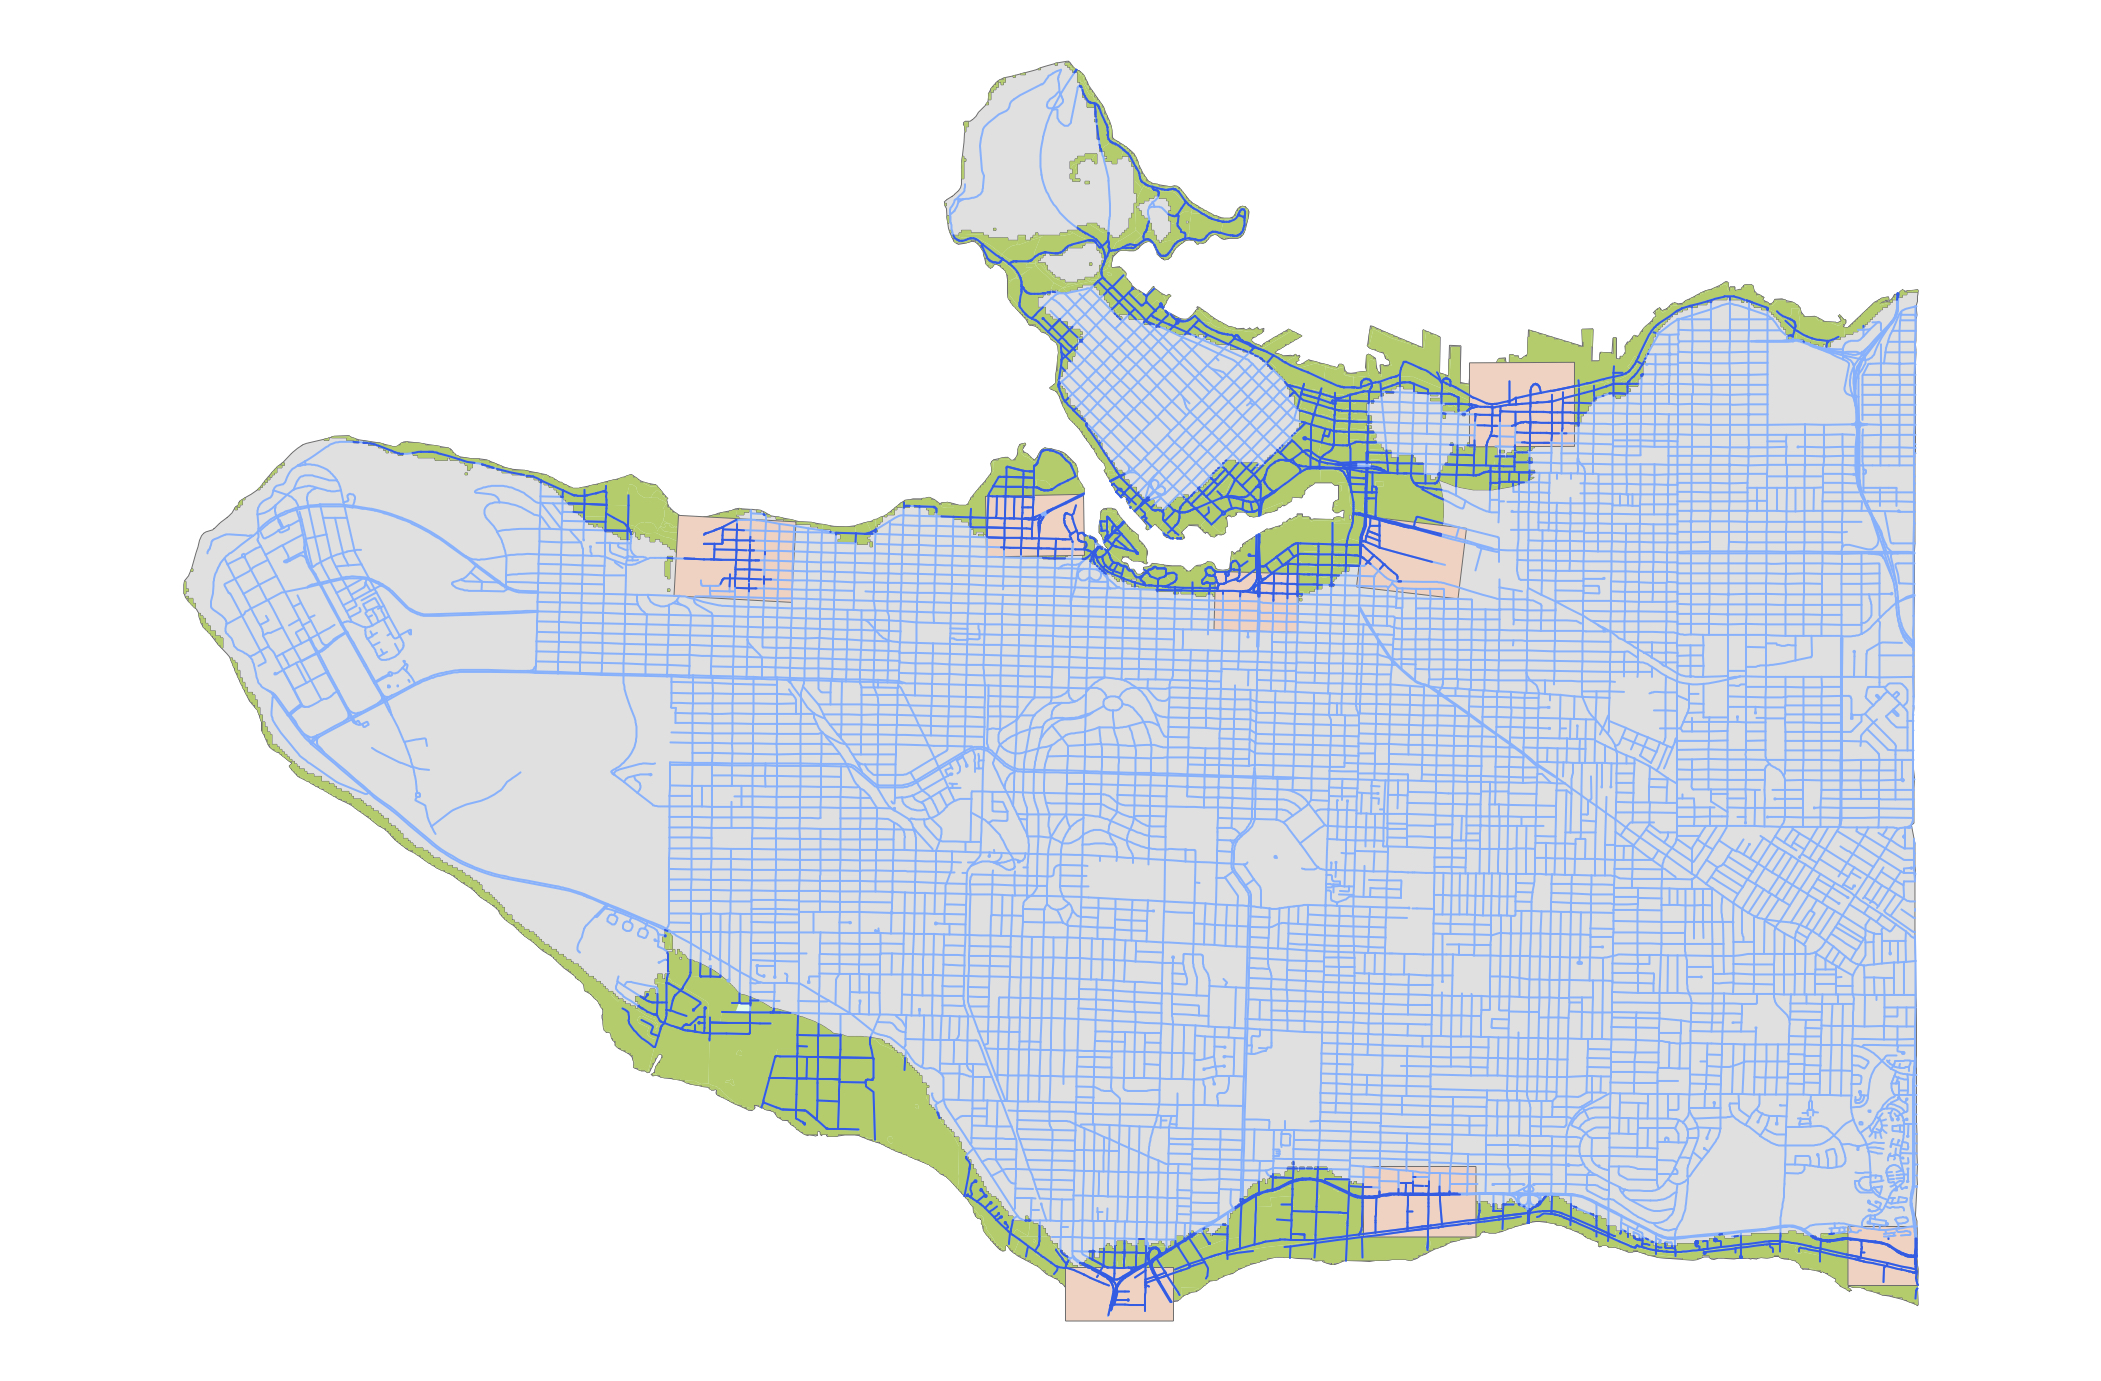
According to my map, 14.8% of City of Vancouver’s total area is in danger. This was calculated this by dividing Vancouver’s total danger area, by Vancouver’s total area. I attained the total area of both by opening the attribute table, right clicking on the Shape_Area column, and viewing statistics. I then divided Vancouver’s danger area (19443772) by Vancouver’s total area (131020800).
List of healthcare and educational facilities within the Vancouver danger zone
| HEALTHCARE FACILITIES IN DANGER ZONE | EDUCATIONAL FACILITIES IN DANGER ZONE |
| False Creek Residence | St. Anthony of Pauda |
| Broadway Pentecoastal Lodge | Ecole Rose des Vents |
| Yaletown House Society | Heritage 3R’s School |
| Villa Cathay Care Home | Vancouver Montessori School |
| False Creek Elementary | |
| Emily Carr Institute of Art & Design | |
| Henry Hudson Elementary | |
| Institude of Indigenous Government |
To attain these answers, I used the Intersect tool. I intersected the Vancouver_LanduseDanger layer with the healthcare layer, then viewed the attribute table to see which facilities resided within the danger zone. I called this layer LanduseDanger_Health. I did the same with the education layer to check for educational facilities in the danger zone. I called this layer LanduseDanger_Education.
To check this visibly, I right clicked on my new heathcare/education layer, clicked Selection > Select All. This highlighted all the points in the layer. I then turned on the new healthcare/education layer and the danger layer and turned everything else off, so I could see the layers clearly. To view the other new layer, I would clear the selection before repeating the Selection > Select All process to view it clearly.