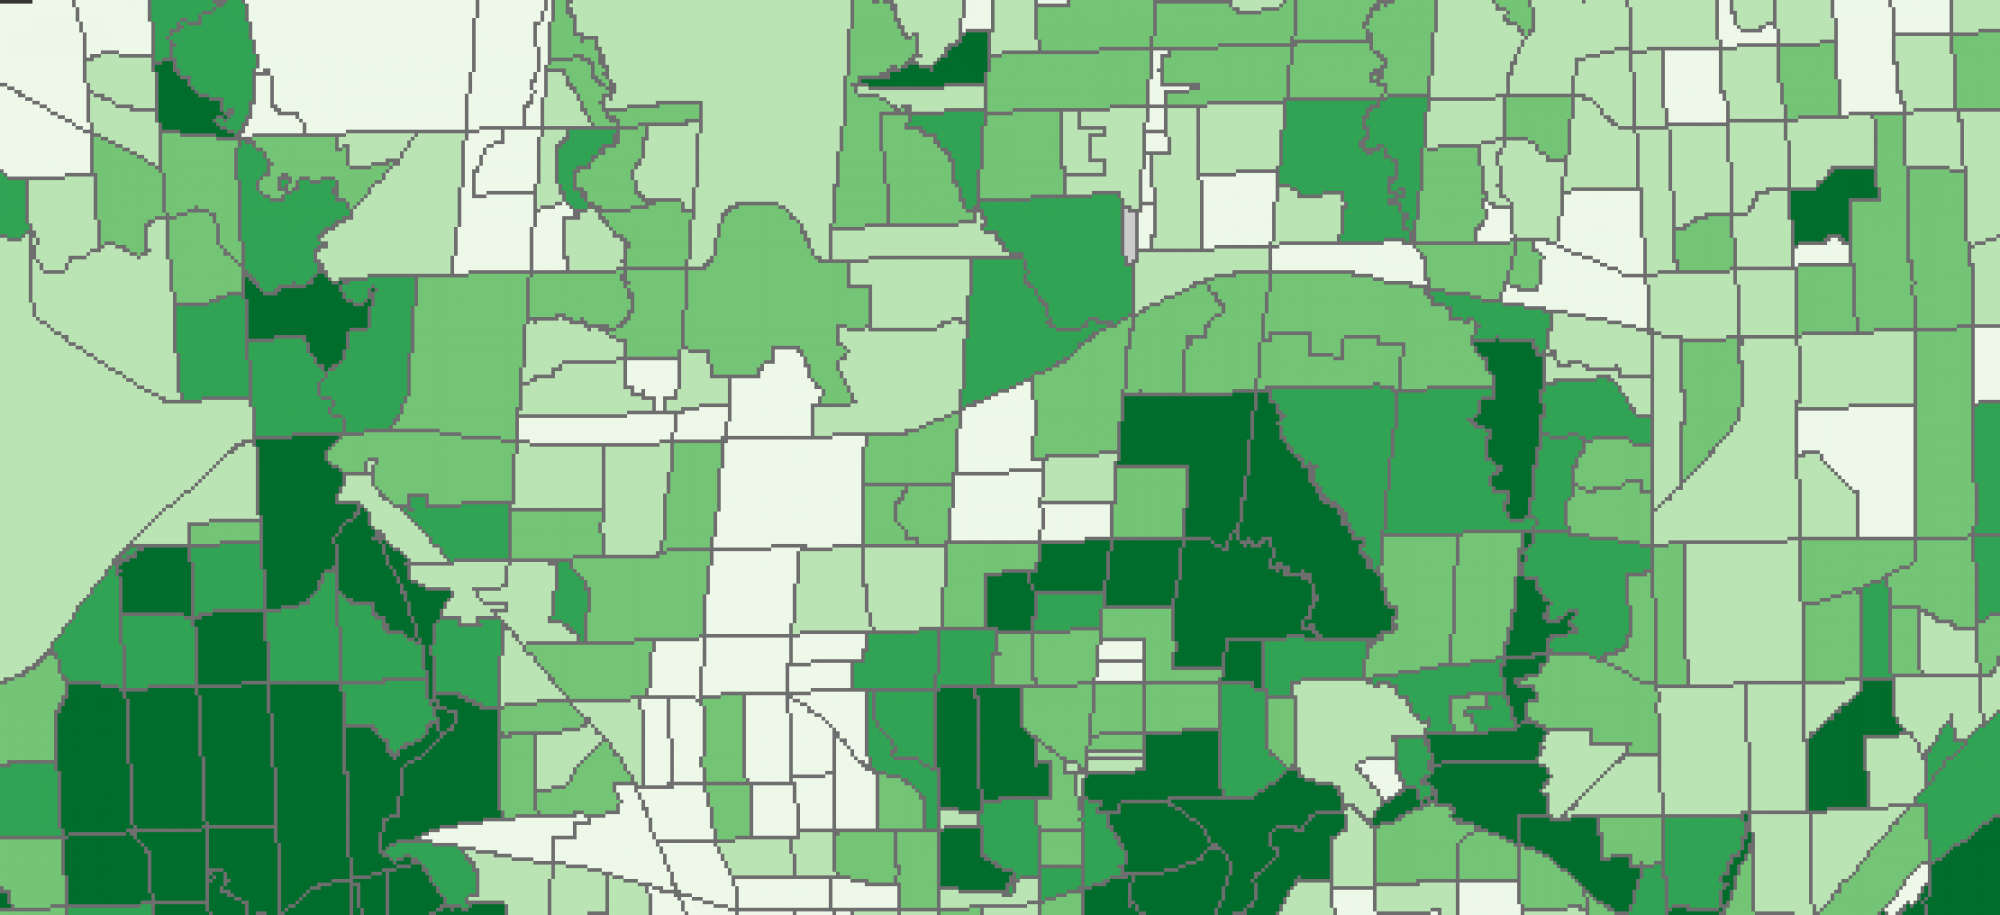
CrimeStat is a spatial statistics program meant to aid law enforcement agencies and criminal justice researcher in visualizing and analyzing spatial data. In this lab we use CrimeStat to apply various spatial modelling and hot spot analyses to crime data collected in Ottawa between Jan 2005 and May 2006. The purpose of these analyses is to highlight the different ways that crime data can be visualized and interpreted to suit different needs or answer different questions about crime.
CrimeStat can yield very interesting results from the analyzing and visualization of data. It includes tools to test for statistically significant clustering like calculating the nearest neighbor index and the Moran’s “I” correlograms, which showcase the extent to which cases of similar crime incidents tend to cluster in space. The software also has analyses to visualize results further on a map surface and view spatial patterns like the fuzzy mode and nearest neighbor hierarchical analyses which showcase areas with high magnitudes of crime incidents. You can also produce weighted surfaces like risk adjusted nearest neighbor hierarchical analysis or the dual kernel density estimate outputs that complicate the idea of crime as being an issue of pure magnitude. All in all CrimeStat is great for viewing crime data within many different variations which can help delineate more narratives or patterns about crime in place.

