Slides for Conference on Longer Lives
by kevinmil
I presented today at a conference organized by the University of Calgary School of Public Policy and CIRANO in Ottawa. The conference theme was “Living Healthy in Old Age: Dreams, Realities and Consequences.”
I have posted my slides here.
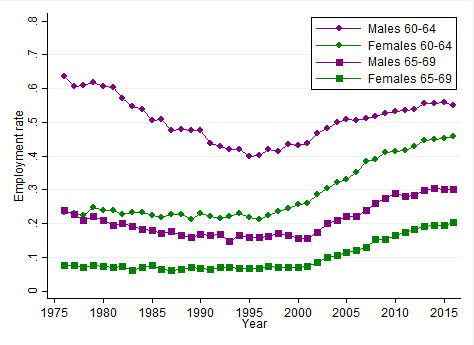
The first main graph looks at employment rates for men and women aged 60-64 and 65-69.
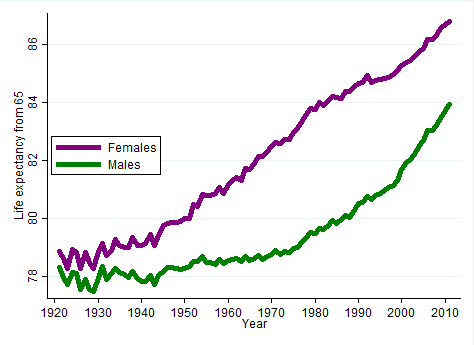
The second main graph shows the evolution of mortality rates for men and women conditional on reaching age 65.
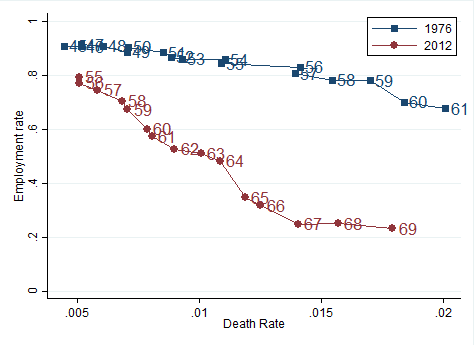
The third main graph compares the employment-mortality relationship in 2012 and 1976.