HELLO, PLEASE NOTE THIS SITE HAS BEEN ARCHIVED AND THE CONTENT HAS BEEN RE-POSTED ON MY NEW SITE HERE:
http://healthycitymaps.blogspot.com/2013/11/2011-census-population-density-at-three.html
——————————————————————————————-


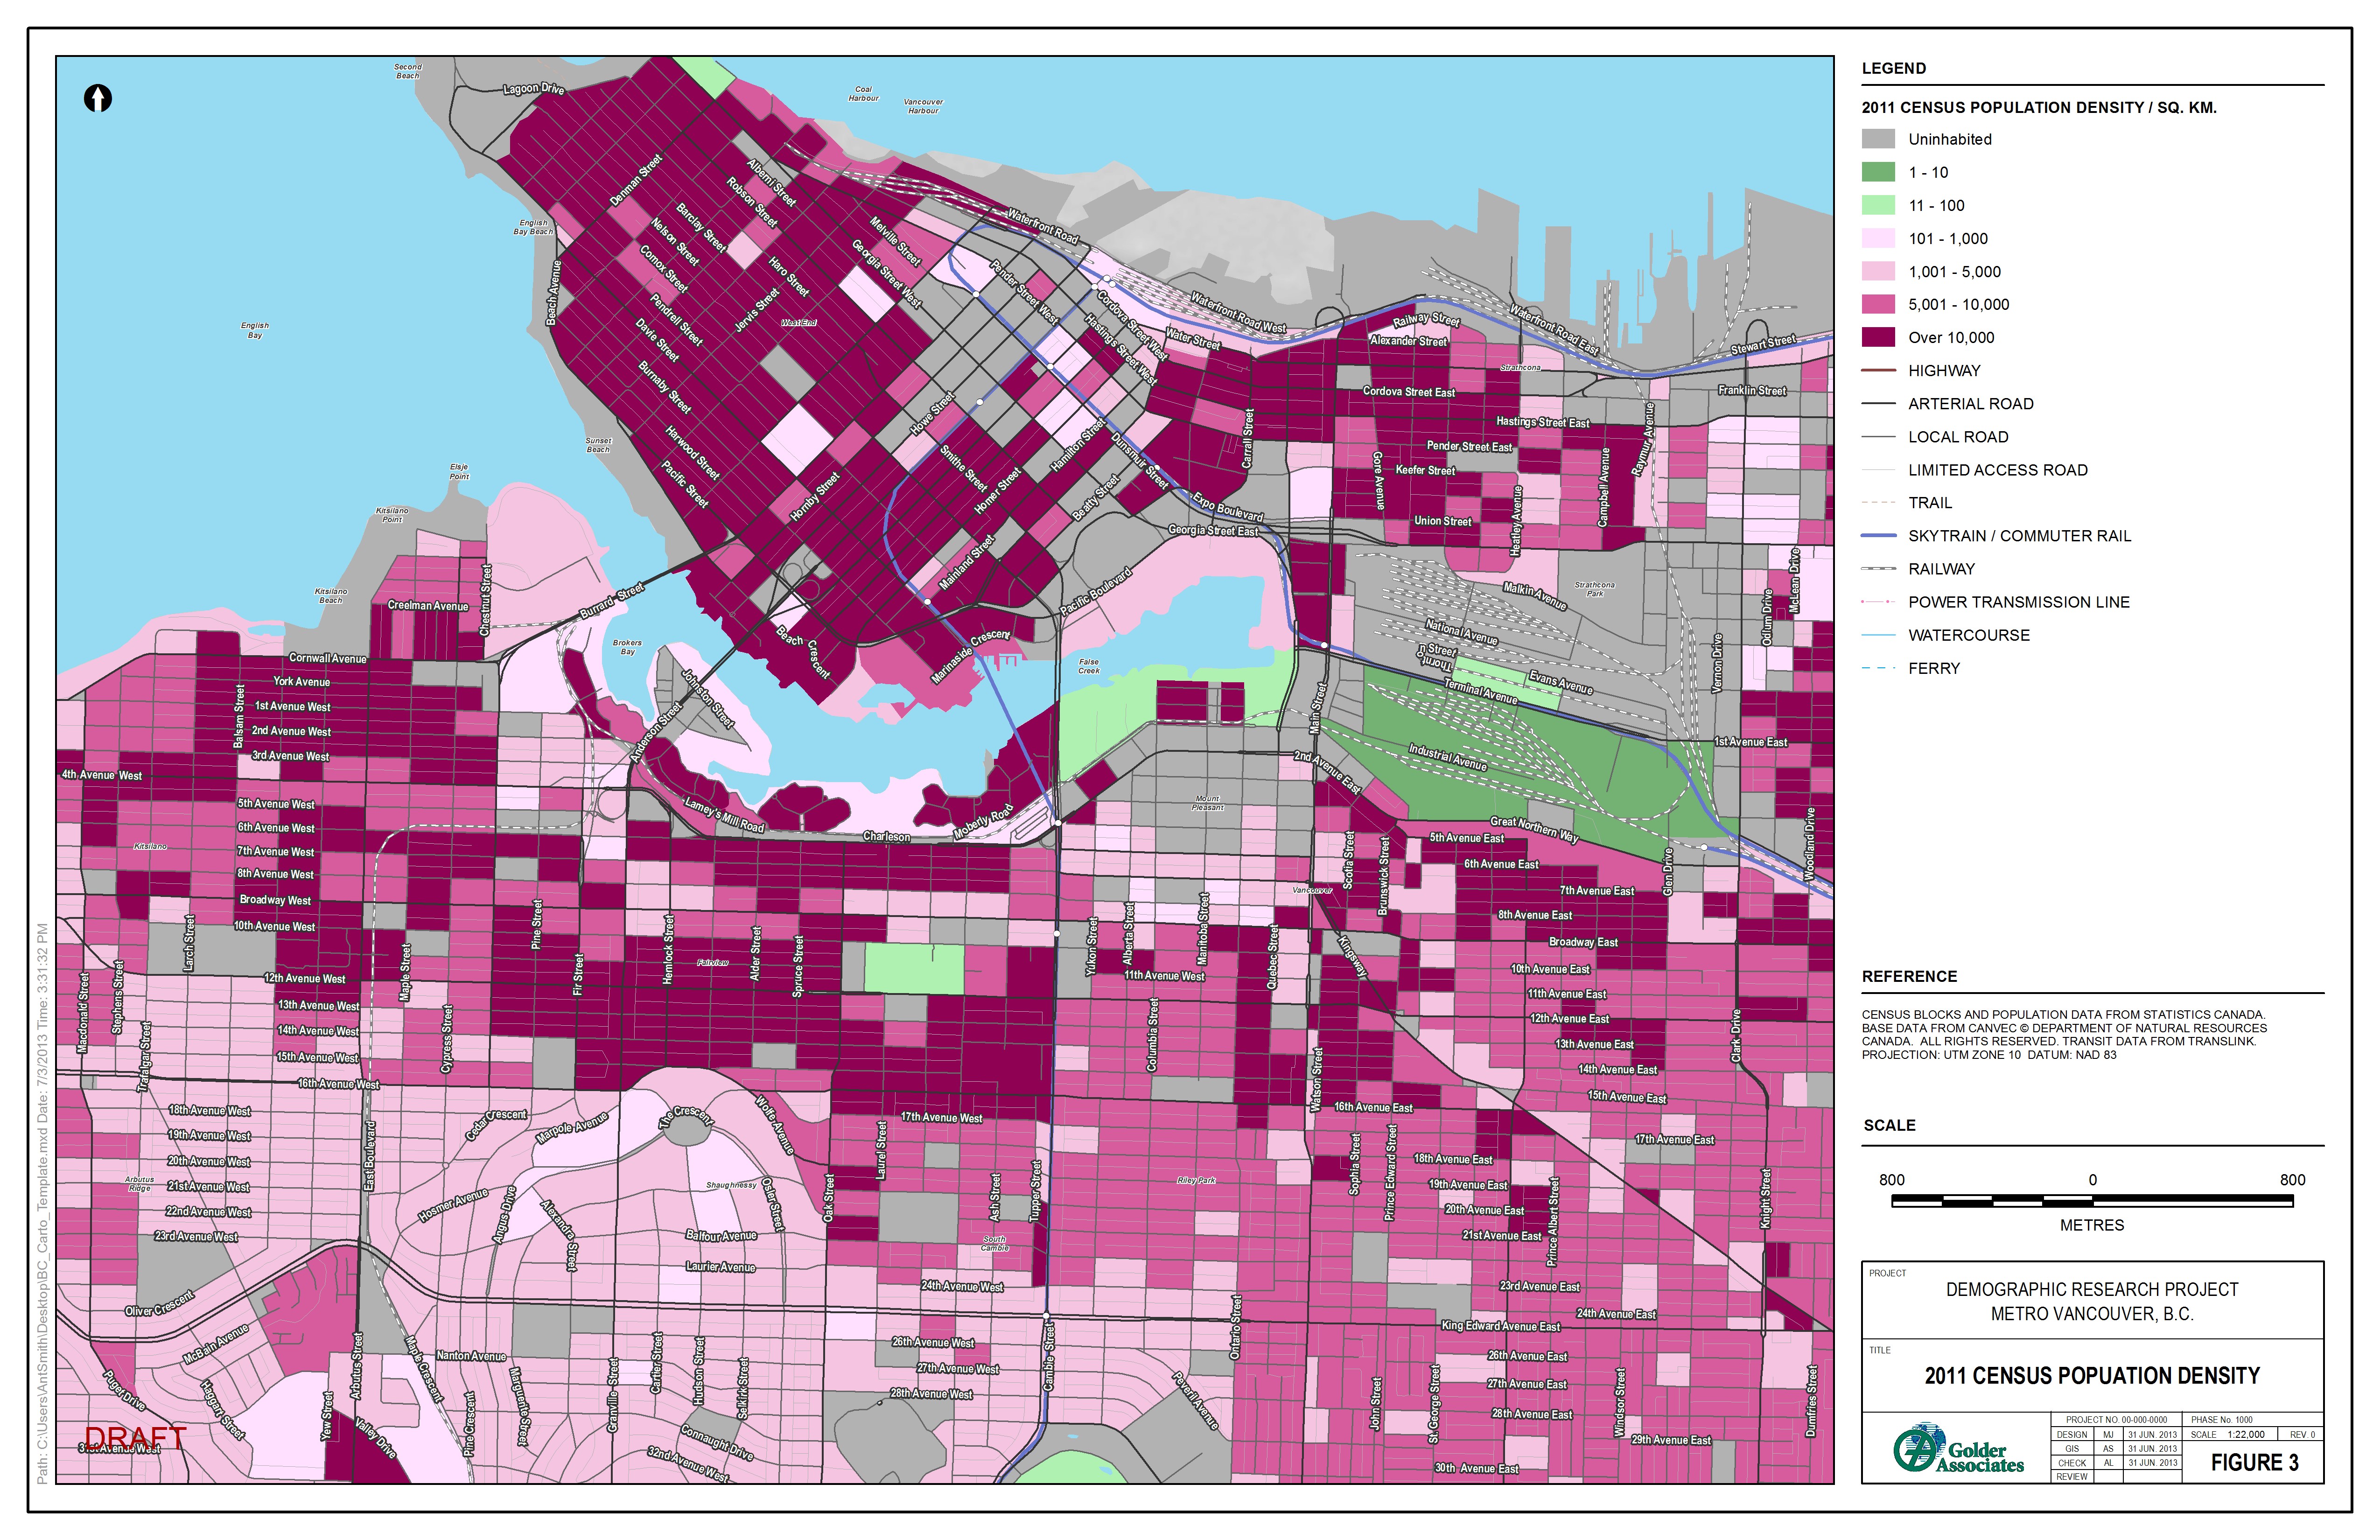
What do you notice looking at these maps? Add a comment below…

Map two link does not work properly. Workaround: open map 1 and then change the 1 in the URL to a 2.
Thanks for doing these and posting in the public domain. It is interesting in the context of density debates in Grandview-Woodland, showing the area to already have fairly high densities.
Thanks for your feedback Marc, I have fixed the link. I am also very happy that these maps can be used to make more informed decisions when shaping the future growth of our city.