WOW. What a journey it has been so far! From choosing our project and meeting our team members and community partners, to completing our first field study and creating our decals, we have come such a long way. But wait, the most exciting part is still yet to come…
To keep you more updated, here’s our timeline for this project!
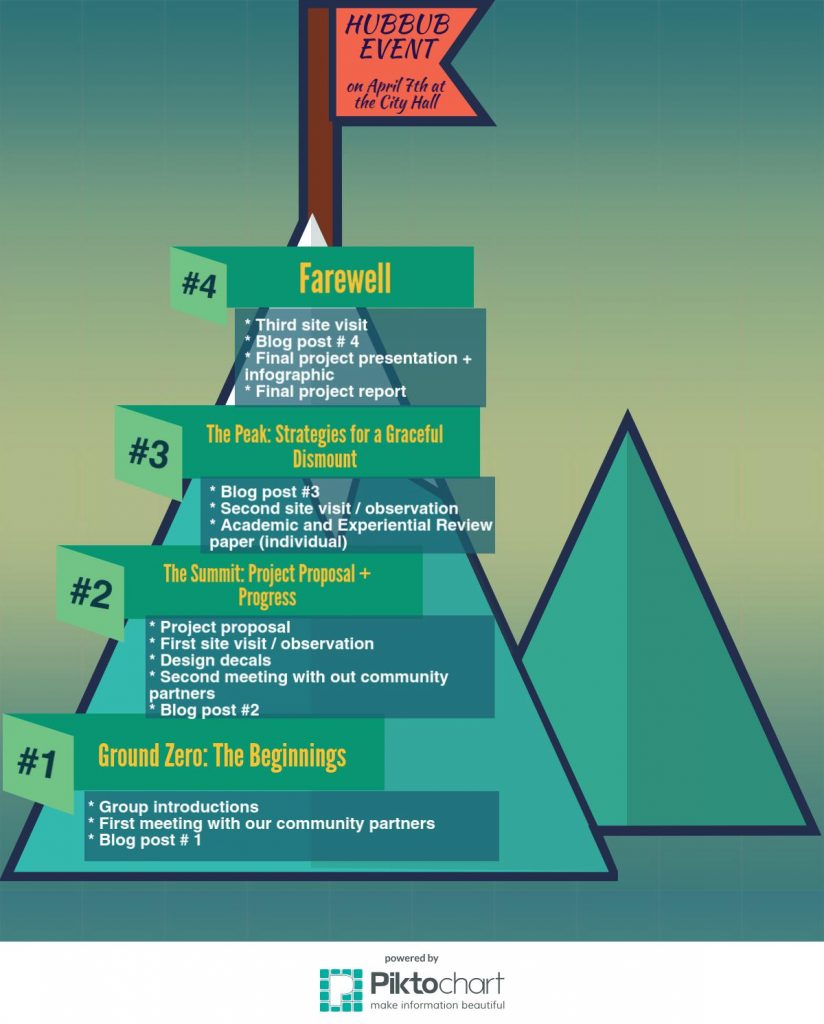
We have successfully overcome Ground Zero and The Summit! Right now, we are climbing our way up to the 3/4 Mark: The Peak. Curious about our moments of significant change? Read to find out!
Weekly Objectives
There is a lot we would like to accomplish in the next seven days. These are our objectives:
- Before we gather the second set of data, at our second site visit, we need to revise our data collection spreadsheet. At our community partner meeting, we reached the consensus that the data we collected on the demographics of the people we observed using zero waste stations at HCC was not significant to the project. Before our next observation, we will need to change the data collection sheet to reflect that decision.
- We will complete our second round of observations at HCC. We have decided to complete our second observation on Sunday March 12th. We’re hoping for good weather, in order to get as much data as possible through having a large amount of traffic in the community centre. Before we go, we will need to size, format, and print out our decals so we can display them with tape onto the bins before our one hour observation window begins. We also plan to do interviews with patrons to gain insight on the thoughts that led to their disposal decisions, as the data we gain from this will be an asset to our project. We will likely need to have consent forms printed for interviewees to sign.
- We need to set aside a time this week where all the members of our group are available to check-in and go over our project timeline and upcoming due dates.
- We will be to begin to prepare for our in-class presentation. As a team, we need to come up with a game plan for the in-class presentation of our project that is taking place on Monday April 3rd. It is already less than a month away! We’re also hoping to meet up during the next flexible learning session on March 20th to discuss ideas and come up with a timeline for completion of the poster board and infographics.
- Get in touch with the other group from our tutorial section that is also doing the “Put Waste In Its Place Challenge” in order to coordinate for the HUBBUB event that is coming up on Friday April 7th.
- Stay in contact with our community partners and TA via e-mail.
Achievements
In the past week, we have made good progress:
- We had our second meeting with our community partners at Vancouver CityStudio and received feedback and suggestions about the decals as well as the progress of our whole project . According to the feedback given, we made detailed plans to revise our decals for the second observation at Hillcrest Community Center(HCC).
- We improved our decals with the material provided by our community partners and formed a more uniform set of decals. This set of decals will be used on our second observation at HCC To test the effectiveness of our revised decals and see if there is a positive impact on waste diversion.
- In the last tutorial, we created the Moment of Significant Change graphs together. These two graphs regarding our progress on emotion and skill/knowledge allowed us to discover the moments of significance of each individual and as a group. By creating and looking at our graphs, the trend of change becomes very vivid and straightforward.
- We discussed and analyzed the Moment of Significant Change graphs and had a review of the overall process of our group project. By studying the graphs, we developed a clear understanding of how we should interact with the course materials in the future and complete the project better.
- We used the Flexible Learning time to integrate the week and work on blog post three.
Moment of Significant Change
WHAT?
When we were assigned the Moment of Significant Change (MSC) graphs in our tutorial session, it was divided into two parts: knowledge/skill and emotion. We started with brainstorming several significant moments that have occurred so far in LFS 350 which we used as the coordinate points on the x-axis. These include: the first day of class, the first time of meeting with our community partners, writing blog one, proposal, the first observation, decal design, the second meeting with our community partners, writing blog two, and the end of term. The y-axis, measures “knowledge/skills gained” in graph one and for graph two, we used face expression icons to symbolize emotional change at each of the points in the term. In graph one, the overall trend is an increase for all group members indicating all of us gaining more new knowledge/skills through each moment of significance, until blog two arrives. All group members show an obvious drop here. Consciously, we absorbed less new information at this point, compared to previous assignments.
SO WHAT?
As a team, our most significant moment of change occurred while we were designing our decals after our first meeting with our community partners. Through talking with our community partners, we learned a lot about the project, its purpose, and all it entails. While we were in the process of designing the decals, we began to understand the potential impact they could have at HCC which allowed us to approach this project with a greater passion and higher level of awareness. Aside from that, we also discovered that we can creatively use our Google docs skills to design the decals. We also applied the data we gathered during our first observation when creating the decals. The data, which includes patrons’ waste disposal habits, provided important information for us to analyze. Naturalistically observing patrons at HCC has made us also look at our own waste disposal habits more closely; something that seems so small and neglectable in our everyday lives can have a great impact over time. With the notes we took during our observations, we compiled our findings into our blog postings. Initially, our group was not completely familiar with how to start a blog. Eventually, with our creativity, originality and resourcefulness skills, we have published a total of three blog postings.
NOW WHAT?
Working on this project, has further fueled our drives to make a positive impact in the community we live in. With that said, we hope that our knowledge and skills on data collecting, making blogs, creating decals and infographics continue to increase as we learn more about how waste management effects food justice, food sovereignty, and sustainability.
In Graph two, the instability of emotional change indicates the confusion and uncertainty we experienced with certain assignments and class activities. At the beginning of the class, all of us were very excited about the opportunity to be able to contribute to Vancouver’s food system and to collaborate with our community partners, CityStudio and the City of Vancouver. This partnership allowed us to gain new insight and a more realistic perspective on an issue that we did not realize was so substantial in our local community. Through meeting with the city partners, we gained more valuable information and different ideas on how to approach not only our decal designs, but also waste management. In relation to our graphs, it shows that our level of skill and knowledge has increased after each meeting with our community partners. This is mainly the result of the feedback they gave us, in terms of our decal designs and our approaches to the project. It allowed us to make improvements on our designs as well as experimental data collection. Being able to hear and learn from passionate professionals in the field of waste diversion with the goal of perfecting our city’s waste management system has inspired us. It shows that the actions we take now have the ability to substantially impact the future of the city’s environmental status.
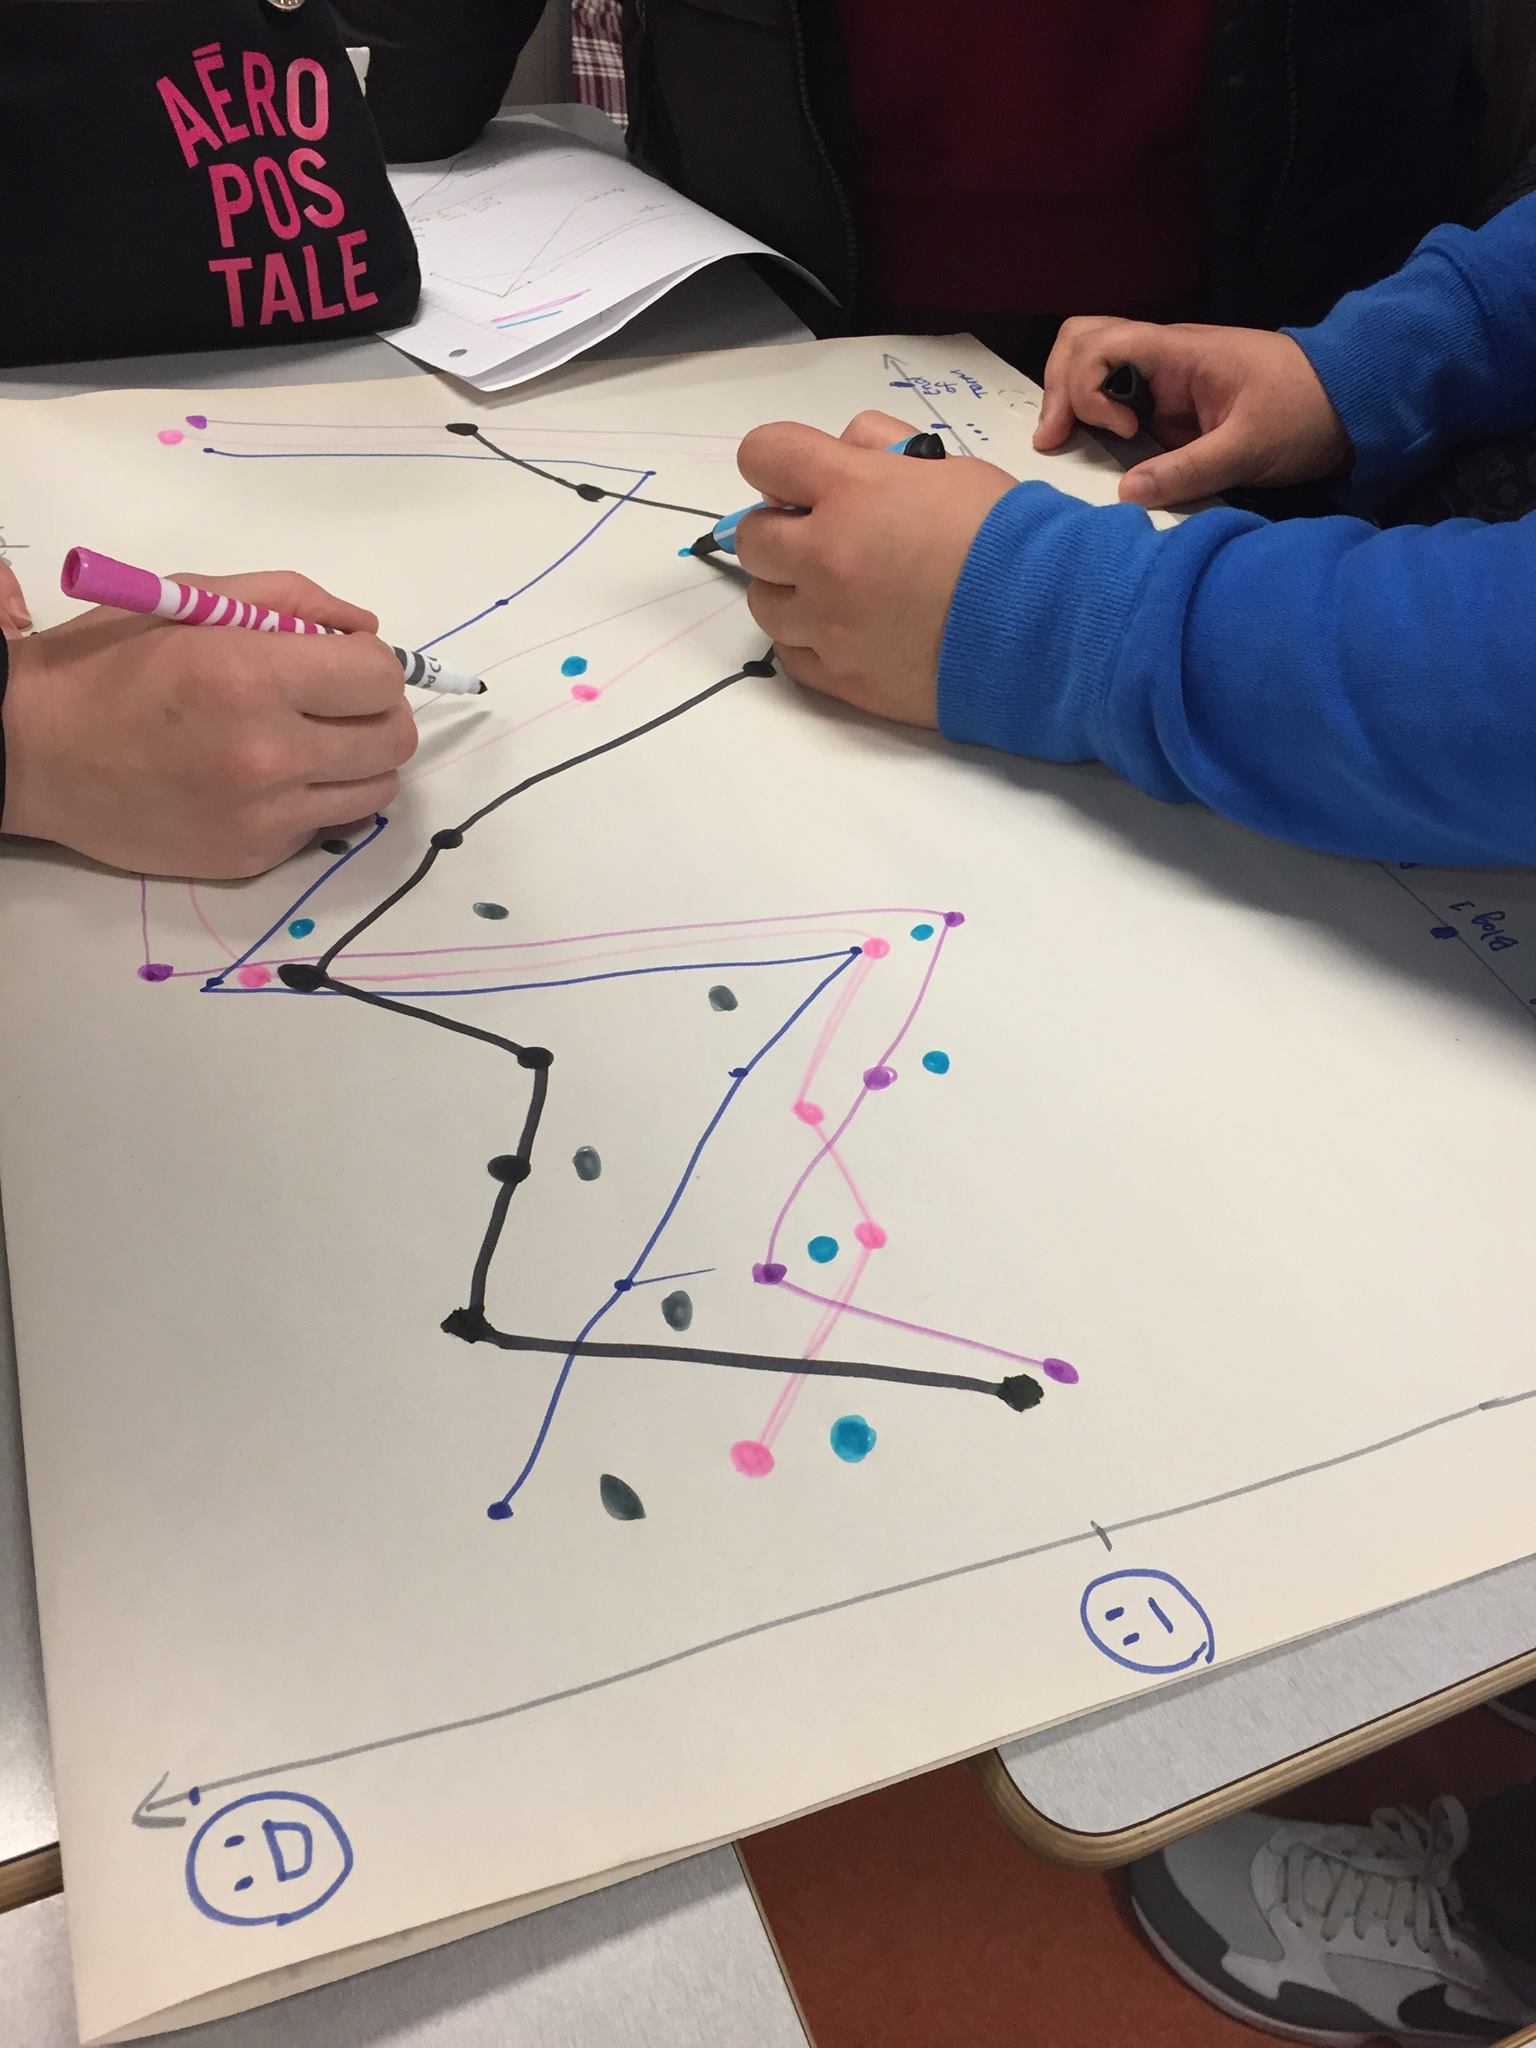 Moment of significant change graph in progress
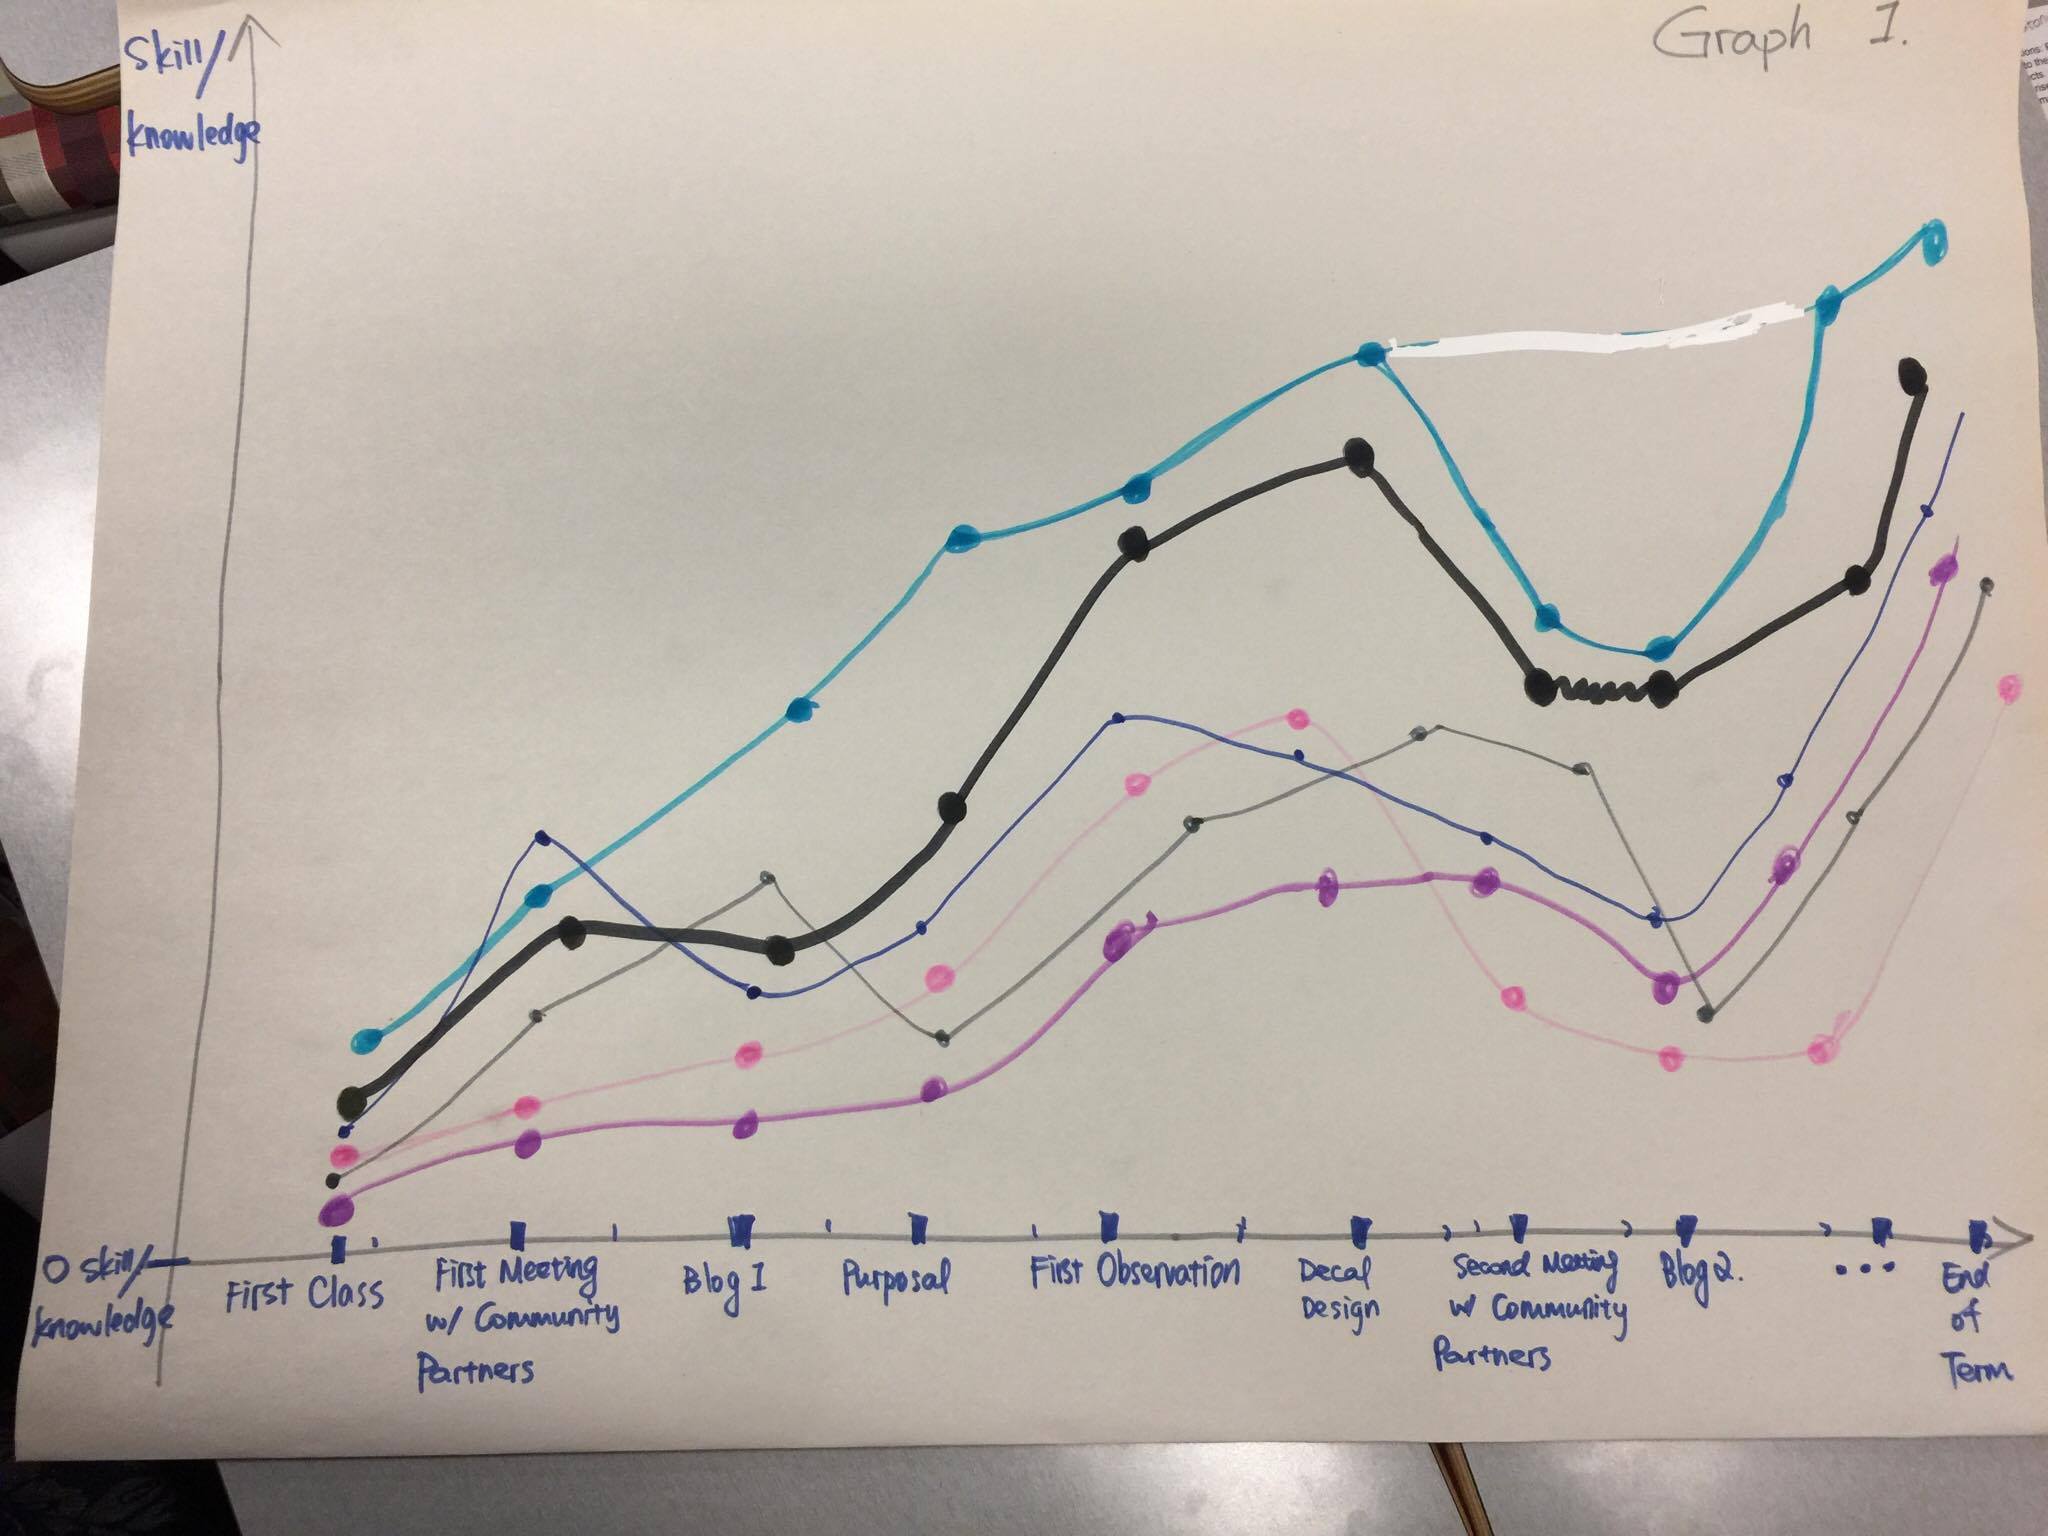
Graph 1. Moments of significant change of our skills and knowledge for the past seven weeks
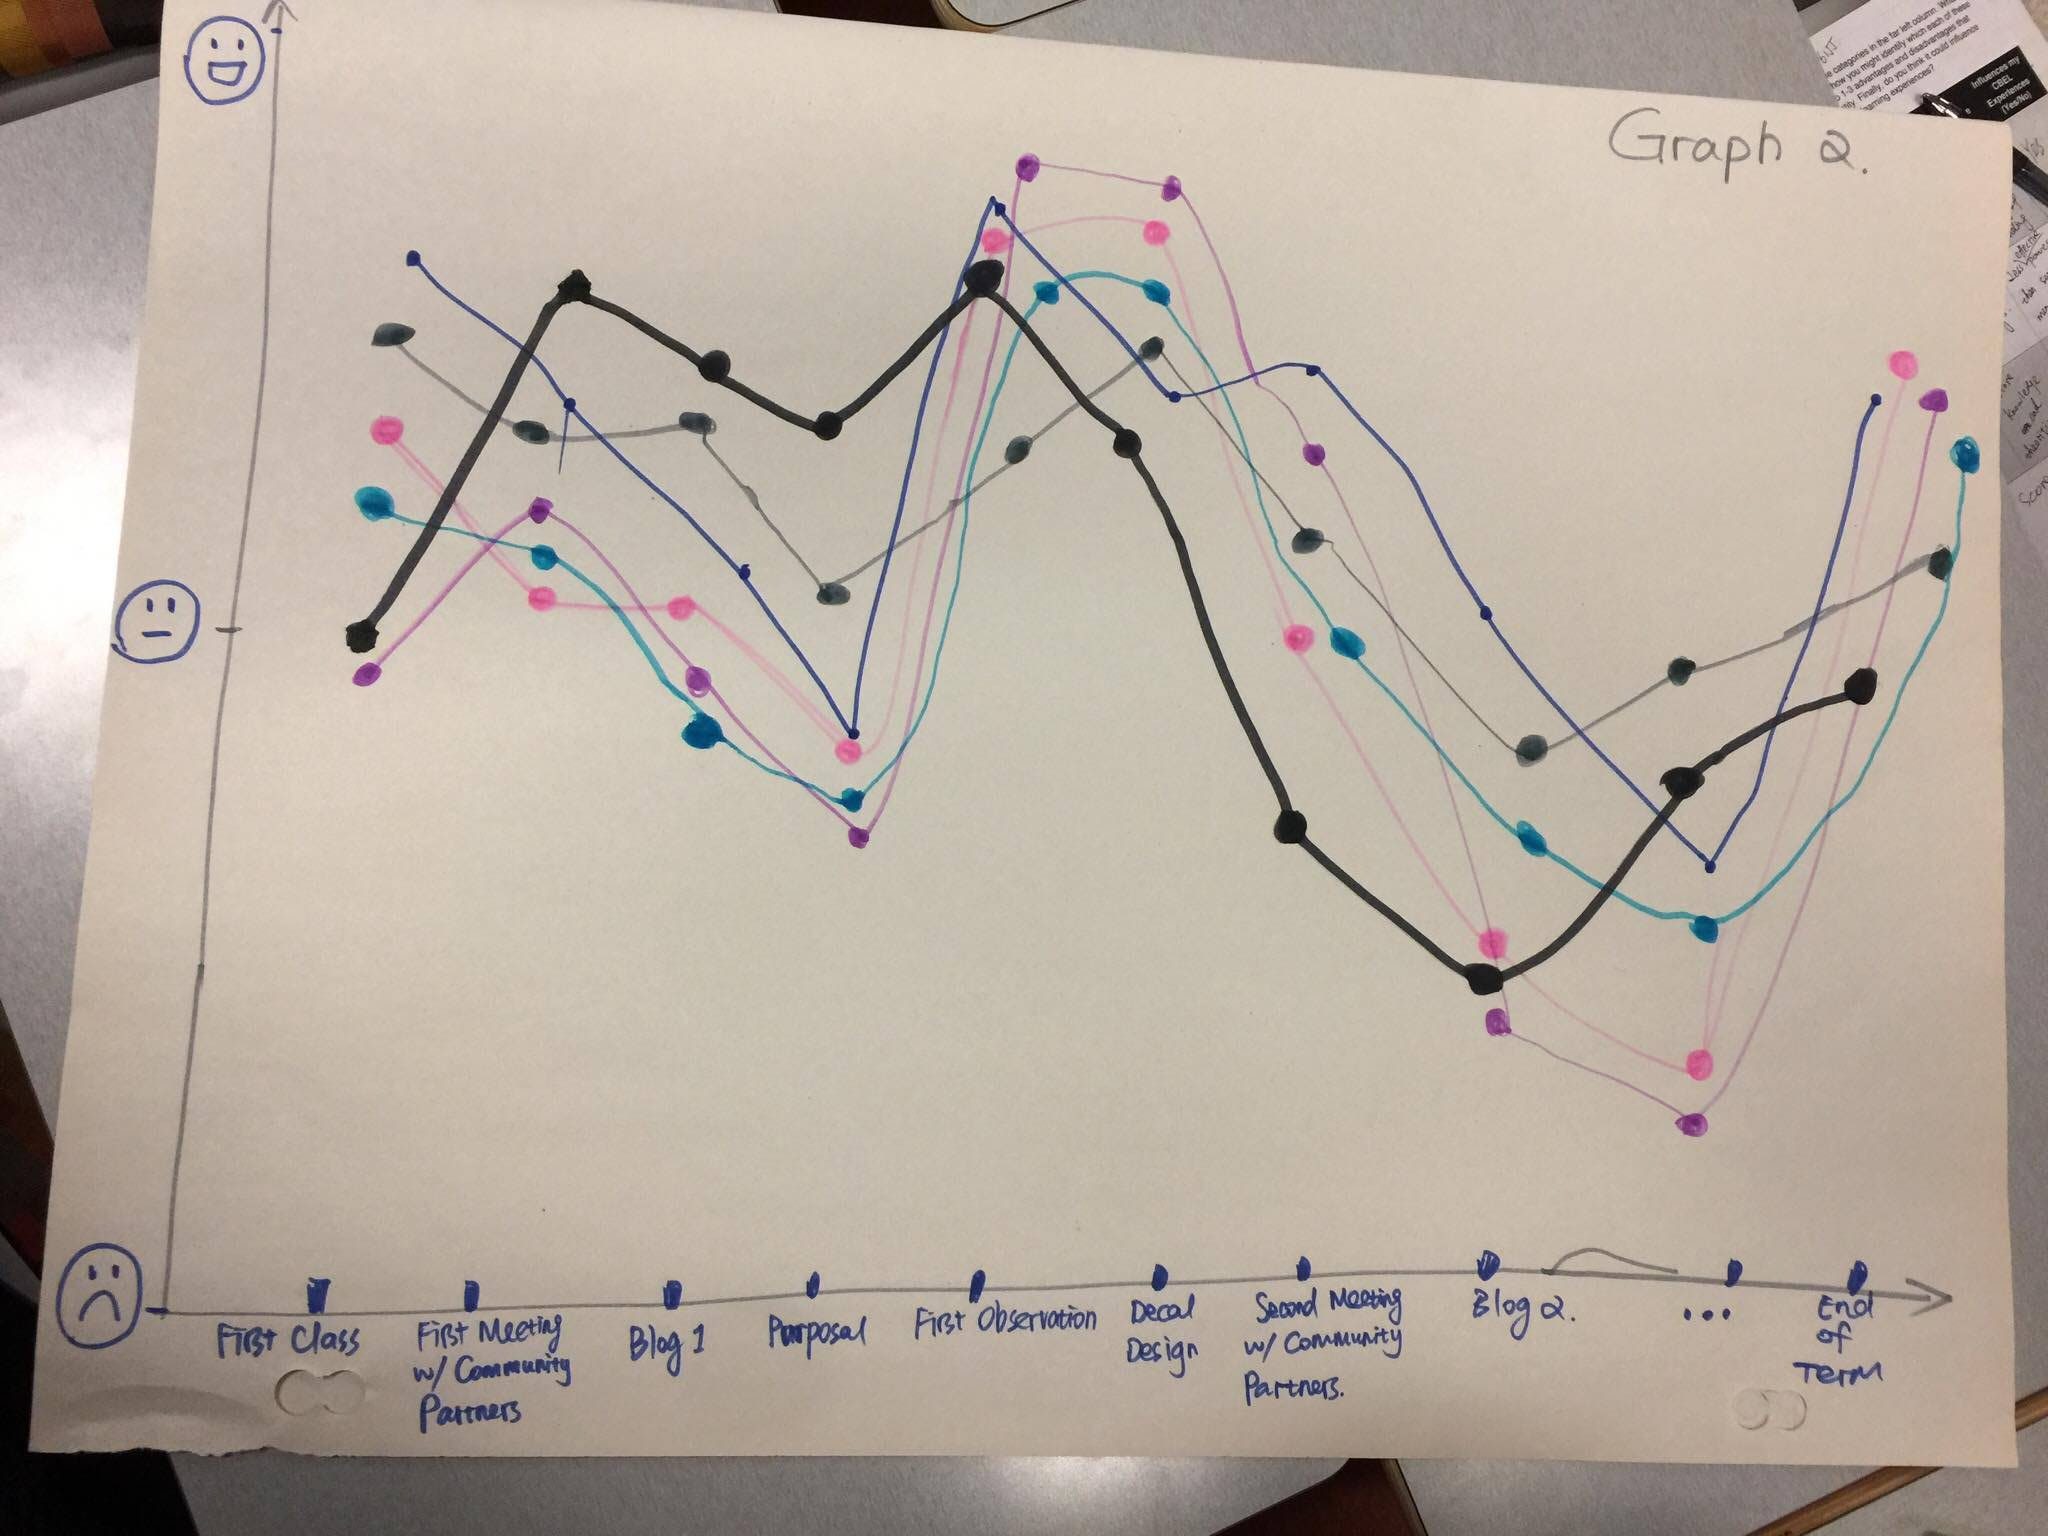
Graph 2. Moments of significant change of our emotions for the past seven weeks
Strategies for Successful Project Completion
As the end of the term quickly approaches, we will use a variety of different strategies in order to successfully complete the Zero Waste Project. First of all, we will continue to stay organized and consistently communicate with each other, our TA and our community partners. We will steadily work on the project, with the aim of completing it ahead of time due to the typical busy nature of the end of term. There is a lot coming up for this course alone, including our individual academic experiential review papers, the HUBBUB event, our LFS 350 presentation, and our final report. We believe that as a group, supporting each other whenever needed honours the value of teamwork. The improvement of skills and knowledge we have gained, as well as risks and challenges taken have inspired us more to passionately collaborate on this project. As Shulman (2005) states, learning takes place when “certain amounts of anxiety and risk” are experienced (p.22). As a group, we understand that the data we collect will benefit the City of Vancouver in finding strategies to improve waste management and diversity, not just in community centres, but in other facilities in Vancouver as well. The true purpose of this project is to measure the effectiveness of our decals in order to bring more awareness to the general public regarding the Zero Waste Project and the 2020 Greenest City Action Plan.
Don’t forget to check back to hear about our second observation at HCC with our newly designed decals!
Reference:
Shulman, L. S. (2005). Pedagogies of uncertainty. Liberal Education, 91(2), 18–25. Retrieved from
http://files.eric.ed.gov/fulltext/EJ697350.pdf