We know it’s always sad to say Goodbyes, but time flies. Here is our last post, we would love to share our final decal design and observation results with you.
What?
After we got the feedback from our community partners, we modified our decal designs and in the late of March, we carried out our 2nd observation at the Kerrisdale Community Centre to test the effectiveness of our decals. For the 2nd observation, we conducted 3 observation sessions on three different dates, March 17th(2:30-4pm), March 26th(2:30-3:30pm) and March 29th (1-3pm). For the 2nd observation, we not only collected the data on the accuracy of garbage sorting but also randomly interviewed five people who used the zero waste station and asked for their opinions towards our decal designs. During the 2nd observation, we sat at the same spot that we did for the 1st observation and observed for the speed and accuracy of garbage sorting. Since the staff told us that the busiest hour of the community center is around 3 pm during the first observation, we arranged our second observation to start somewhere around 3. Just like the first observation, sometimes it is hard to see the type of garbage that the person is throwing because our observation spot was a bit far away from the zero waste station, so we had to run over to the garbage bin after the person left and lift the lid to check if the person had sorted correctly. For the first observation session on Mar.17th, there were only five people using the zero waste station during observation period, so we had to schedule follow-up observation session in order to increase our sample size. In the first observation we observed 17 people, so this time we wanted to observe at least 15 people so we could compare the result to the first time. Therefore, we had two more observation sessions at the community center and finally increased our sample size to 16.
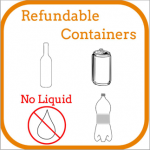
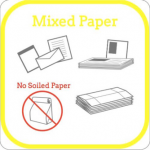


Figure 1. Modified Decal Designs
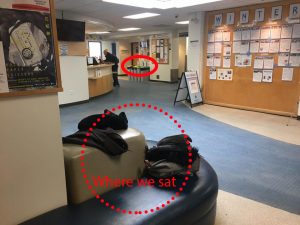
Figure 2. Observation Spot at Kerrisdale Community Centre
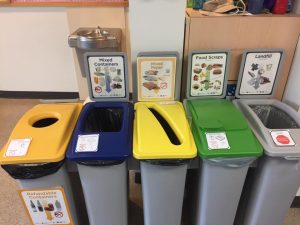
Figure 3. Decals on the Zero Waste Station
Results
Our moment of significance came after analyzing the raw data. The overall accuracy of waste sorting for the 2nd observation is 68.75% and the average sorting time is 2.7s. Although it is still well below the diversion rate of 79% presented by our community partner, it is much higher than the result of the first observation which is 59% and the average time used for sorting is 0.9s less than the first observation.
For the interviewing part, we asked the participants whether they have noticed the decals or not, and asked them to rate the effectiveness of the decals out of a score of 5 and lastly, we asked for their suggestion for improvements. From the five people we interviewed, they all noticed the decals on the garbage bin and they gave an average score of 4/5 for the effectiveness of the decal designs and most of the comments from the interviewees are positive. Due to the small sample size, we cannot draw any conclusions based on our findings. However, by comparing the data we obtained from the 1st observation and the 2nd observation, we see an increase in garbage sorting accuracy rate and also a reduction of sorting time; this might imply that our decals did help people to sort their wastes better. Also, the data and comments that we collected from the interviewing part also indicate that our decals are successful for their function.
Difficulties
Some difficulties that we encountered during the group work is that it is very hard to schedule the observation time that can fit everyone’s schedule. Sometimes the scheduled observation gets postponed due to lack of people available for the specific time period or sometimes something unexpected happens which leads to the unavailability of a member at the scheduled time. We wanted to have at least 3 members present at the observation session since we have 3 observation tables to fill out.
Another difficulty we encountered is that during the 2nd observation session on March 26th , the staff at the community center did not allow to put our decals on the zero waste station due to lack of the Kerrisdale Community Centre supervisor’s approval. Even though we had the permission from our community partner we still need to get the permission from the supervisor of the community center. Fortunately, after negotiating with the staff, she allowed us to do the observation but she informed us to get the permission from the supervisor for the next observation session.
Although our journey to achieve the final point of this project wasn’t a straight line, we alway kept in mind that “without a certain amount of anxiety and risk, there’s a limit to how much learning occurs (Shulman, 2005)”. We treated all the difficulties as our learning processes instead of barriers. As a group we bonded and made decisions together. As individuals, we learned to improve our communication skills and interpersonal skills.
So what?
By comparing the accuracy rate of the 1st and 2nd observation, we can see there is almost 10% increase in the accuracy rate and the average time people spending on garbage sorting decreased by 26% in relative to the average time of 1st observation. The numerical data based on observation implies that our decals did help people to sort garbage faster and more accurately. In order to know if the participants have actually noticed the decals and use the decals to help them sort out the garbage, we decided to interview 5 people randomly and ask for their thoughts on the decals.
As mentioned by Berry(1999), interviewing is a method for educational research and it is a key method for data collection. An unstructured interviewing helps researchers to elicit information in order to achieve a holistic understanding of the interviewee’s point of view(Berry, 1999). Since our purpose is to help the people in the community center to perceive the meaning of our decals and to make the right sorting decision, their views of the decals are especially important to us for further modifications. Since individuals vary in their ability to articulate thoughts and ideas(Berry, 1999), we constructed 3 straight forward questions to ask the interviewees. The three questions are “did you notice the decal?”, “how much did the decals help you out of a score of 5” and “do you have any suggestions for improvement”. Predictably, all interviewees noticed the decals and the average score for the decals on effectiveness is 4 out of 5. However, one interviewee gives a score of 1 out of 5 for the effectiveness and he suggests us to have other languages printed on the decals because non-English speakers might not be able to recognize the difference among the decals. His suggestion is worth thinking because Vancouver is home to 913,300 immigrants and they account for 40% of Vancouver’s total population; and among the immigrants, Chinese, Indian and Filipino are the largest immigrant groups in Vancouver.(Statistics Canada, 2016) Therefore, adding a second language for the decals might be a great idea to help the immigrants to sort wastes correctly. The other four interviewees all provided positive comments for our decals as they think our decals are easy to follow and understand.
Another thing we noticed is that among the 5 times people sorted incorrectly, 4 of them are associated with paper items and this is very similar to the outcome of the 1st observation. In the 1st observation, there were 7 people in total that sorted the garbage incorrectly and 6 of them are related to paper items. People seem to be confused with sorting paper items even after we modified our decals and this might be due to that they think the paper items should go to the landfill bin instead of the mixed paper bin. This observation suggests that we can put up a stop sign with paper items on the landfill bin in order to raise people’s awareness of paper waste sorting.
In the 2nd observation session, the staff in the community center did not allow us to observe at first because we do not have the permission from the community center supervisor. From this incident, we learned that it is our responsibility to think of all potential obstacles that we might encounter during the observation session and we should do the best preparation in order to prevent any misunderstanding between us and our community partner.
Now What?
Due to the high rate of inaccuracy with sorting paper items, a special sign on the landfill decal might be needed to prevent people from throwing paper items into the landfill bin. Although Our decals seem to be successful and effective in comparison to the result from the 1st observation, the small sample size is a limitation for us to determine the effectiveness of our decals and we think the result would be more convincing if the sample size is larger.
All good things come to an end. We are very thankful to City of Vancouver and CityStudio for the opportunity to collaborate on such an interesting project. While our data is was limited and our findings even more so, it opened our minds to the possibility of real change in the community and maybe even the world. The project may be finished, but we will not forget what we learned about waste management and will continue to seek ways to contribute to zero waste community in Vancouver in 2020 . Last but not least, thank you, Jeanie Morton and Paul Gagnon for all your help, we couldn’t have done it without you guys.
Reference:
Berry, R. S. (1999, September 28). Collecting data by in-depth interviewing. Retrieved April 02, 2017, from http://www.leeds.ac.uk/educol/documents/000001172.htm
Shulman, L. S. (2005). Pedagogies of uncertainty. Liberal Education, 91(2), 18–25. Retrieved from http://files.eric.ed.gov/fulltext/EJ697350.pdf
Statistics Canada. (2016, September 15). Immigration and Ethnocultural Diversity in Canada. Retrieved April 02, 2017, from http://www12.statcan.gc.ca/nhs-enm/2011/as-sa/99-010-x/99-010-x2011001-eng.cfm