A story map visually displays data in relation to places, location, or geography, and story mapping is the process of finding and analyzing the connections among human experience and place. Story maps can be simple or complex, low or high tech. And, story maps help in analyzing complex social issues such as human rights, climate change, refugee resettlement, student transcience, and community integration.
First, a simple example.
In a study of climate change, researchers worked with Ecuadorian subsistence farmers, used Post-It notes to facilitate a community discussion on climate change. Using a map as the basic reference, farmers in the mountainous central Ecuadorian province of Cotopaxi answered three questions: Has your community changed since you were a child? How has the climate changed since then? Are there any past climate-related events that affected 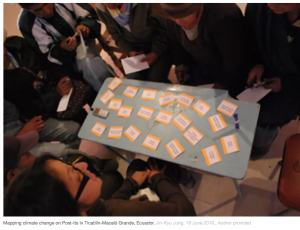 you the most?
Responses were posted to the map, illustrating connections between place and observed human (such as illness) and climate (such as agricultural pests) events.
While this data collection and analysis was part of larger mixed methods approach, it illustrates how mapping human experience enhances our understanding of climate change. (Here is the article.)
More sophisticated examples.
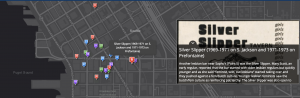
Using existing web based templates (like StoryMapJS) or even Google Maps a story can be build that illustrate events and relationships. These tools rely on a narrative that moves through geographical space and the flow can be in space or time and space. An example of the former might be a subway line or interstate highway along which events, places or people can be placed. This story map of the Green Line train in Minneapolis is a good example. A static map example is of Pioneer Square in Seattle as a center for Queer history in that city. An example that combines movement through time and space is a story map illustrating the shifting population throughout USA history.
Often, story maps use GIS (geographical information systems) software, most commonly ArcGIS. Here is a link to Environmental Systems Research Institute, the most common portal for the use of this software, with illustrations from marketing, social science, and natural sciences. There are lots of examples on this website, but this story map of the experience of Rohingya refugees is a good place to start.
Story maps are often web-based, which facilitates interactivity and reveals movement within the story.
What applications might this have in educational research? Here are just a few ideas.
- Student mobility is an issue in the lives of some students, the quality of education received, experiences in school, and the experiences of schools. Mapping student mobility within a district or city combined with interviews, performance data, family characteristics, school environment and so on could provide insight into the experience of transcience and help schools plan better for the inevitability of student mobility.
- We know standardized test scores correlate as much with social class as with ability. Social class is closely linked to neighbourhoods and so mapping scores onto neighbourhoods, with additional information about income, types of housing, and cost of housing would reveal this relationship succinctly.
- Generally, one might examine issues of space and educational inequality. Inequality that stems from race, ethnicity, or special needs are geographically unevenly distributed and revealing that distribution in communities, districts, schools and even classrooms could be done with story mapping.
 Follow
