Hi guys! It’s been a while since our last post. In this post, we will update you on our weekly objectives and achievements. Besides that, as our project will sadly end in a month, we want to share our moment of significant change throughout our project with you. On the positive note, we have our observational data for our final site visit to Killarney Community center! Curious whether the new decals left an impact? Read to find out!
**Changes made in blue**
Objectives for this Week:
- Discuss
secondthird site visitdata collection visitfindings as a group and comparedatato first and second site visitdatafindings.This will prepare us for our third (last) data collection visit.ThisItwill allow us to analyze our data as a whole, determine what worked, what didn’t work, and how we shouldmake use of our datapresent the findings of our data in a cohesive manner for our final project. - Compile all data collected and write out findings in understandable language that can be used in our final infographic.
Compile all data collected in all three site visits, and discuss how we will use, analyze, and present this data. - Discuss logistics
toof our invitation to the Hubbub event at City Hall on Dec. 2nd and to send information to our community partner (Who can make it, any community partners we want to invite, determine what equipment we will need during the event, how many posters we want to present, and who can stay to help set up/clean up of event). Continue thinking andStart planning poster ideas for Hubbub event at City Hall on Dec. 2nd. Consider combining data and co-creating a presentation with the other “Zero Waste Station Challenge” group. Discuss if we will be able to create one poster for both the LFS 350 course and Hubbub event.- Group check-in regarding project timeline, important dates, and future objectives: blog postings, assignments, final presentation, project and posters.
Weekly Achievements:
- Created “Moment of Significant Change” graphs which allowed us to discover our individual and group moments of significance and reflect on our progress in skills, knowledge and emotions throughout the term so far.
- Reflected on our group goals for the end of the term related to skills, knowledge and emotions.
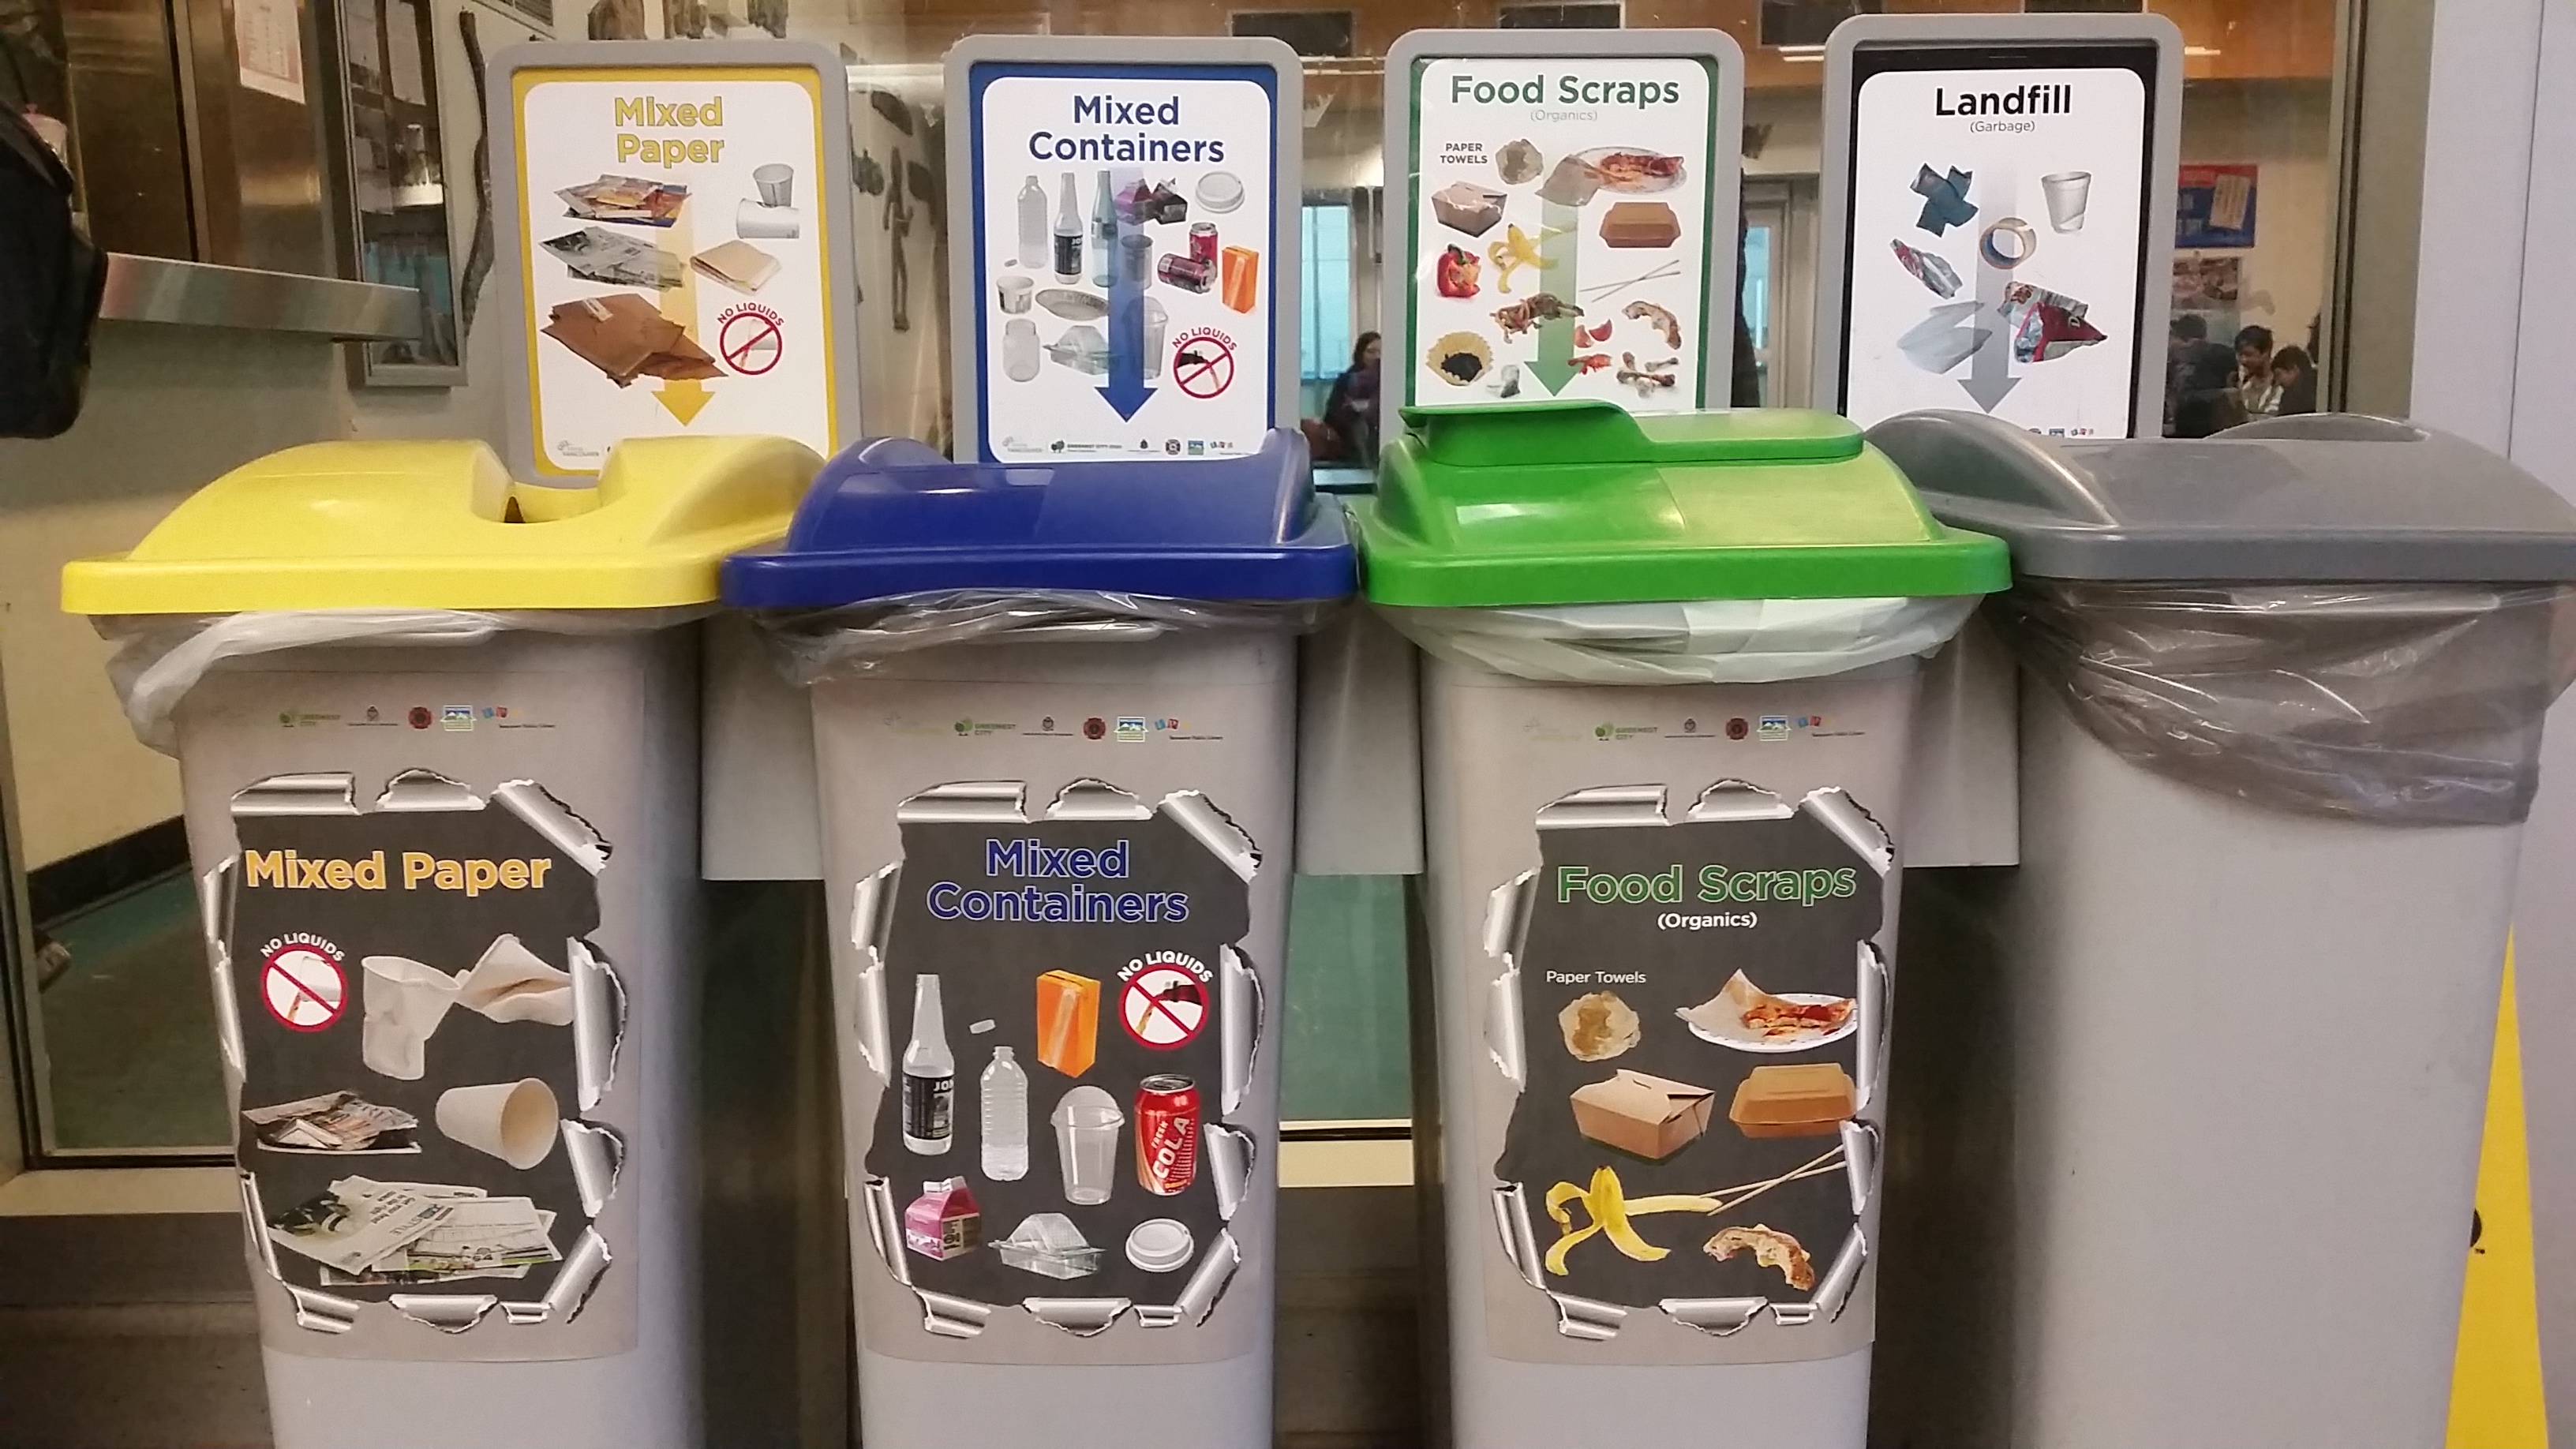
- Completed our third (final) site visit to gather data regarding the effectiveness of the new waste decals after 2 weeks of implementation.
What?
Moment of Significant Change Workshop
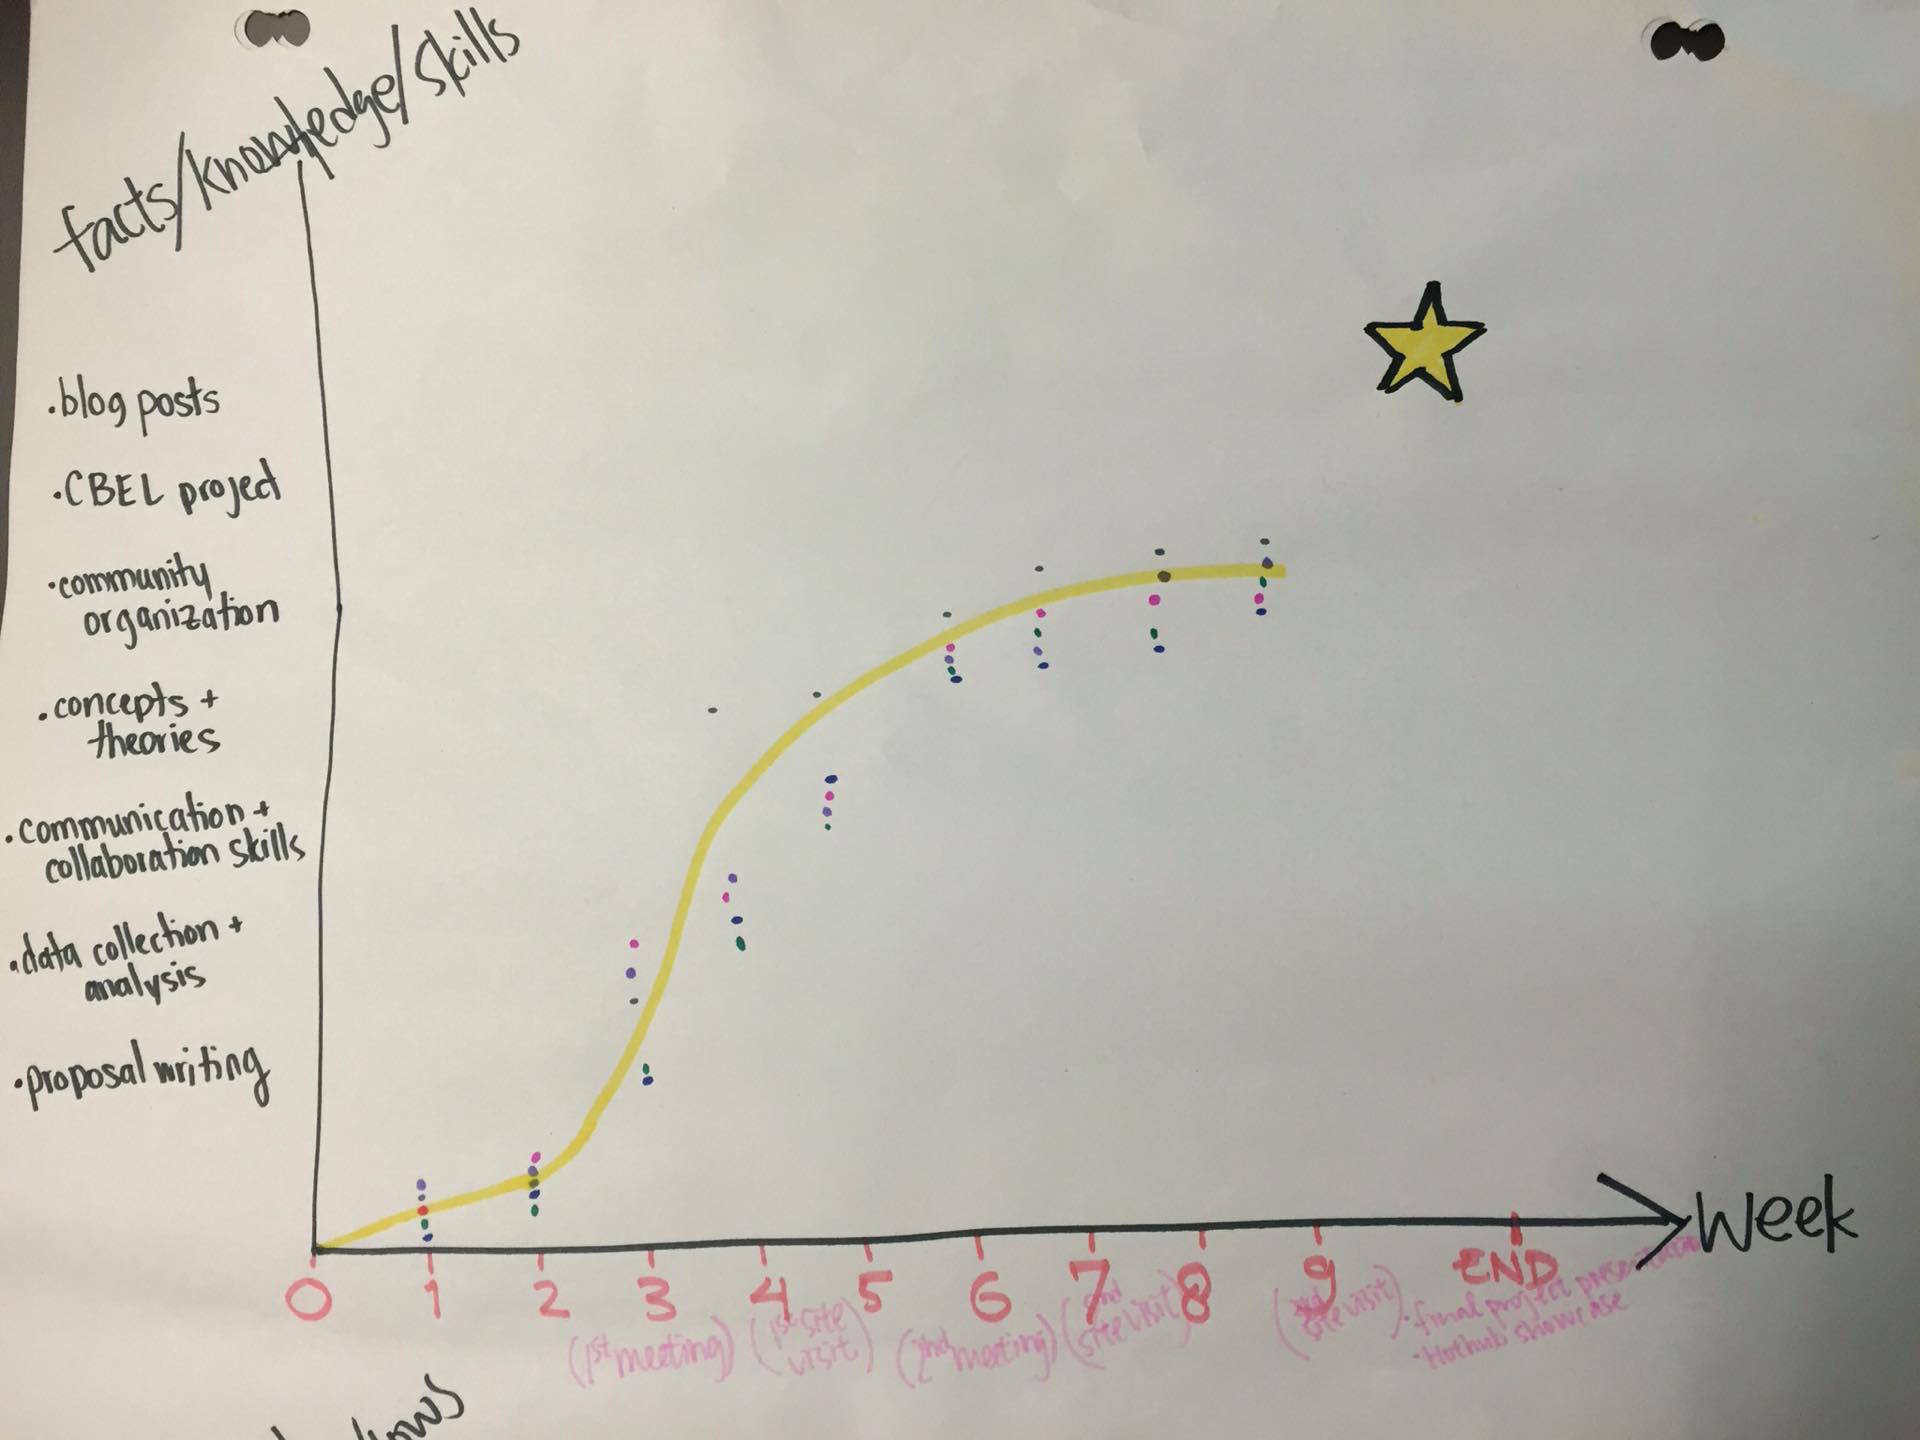
During our Moment of Significant Change workshop, we first created individual graphs illustrating our personal progression in skills, knowledge and emotions throughout the term so far. The y-axis represented specific skills or knowledge that we have acquired, or types of emotions we have felt. The x-axis represented the progression of time throughout the term, indicated by specific weeks and significant events that occurred throughout the term. After this, we compiled all of our graphs into two, larger graphs representing the data of our whole group. Some of our most significant events included our community partner meetings, group meetings and site visits. We used a best-fit line to combine all of our graphs.
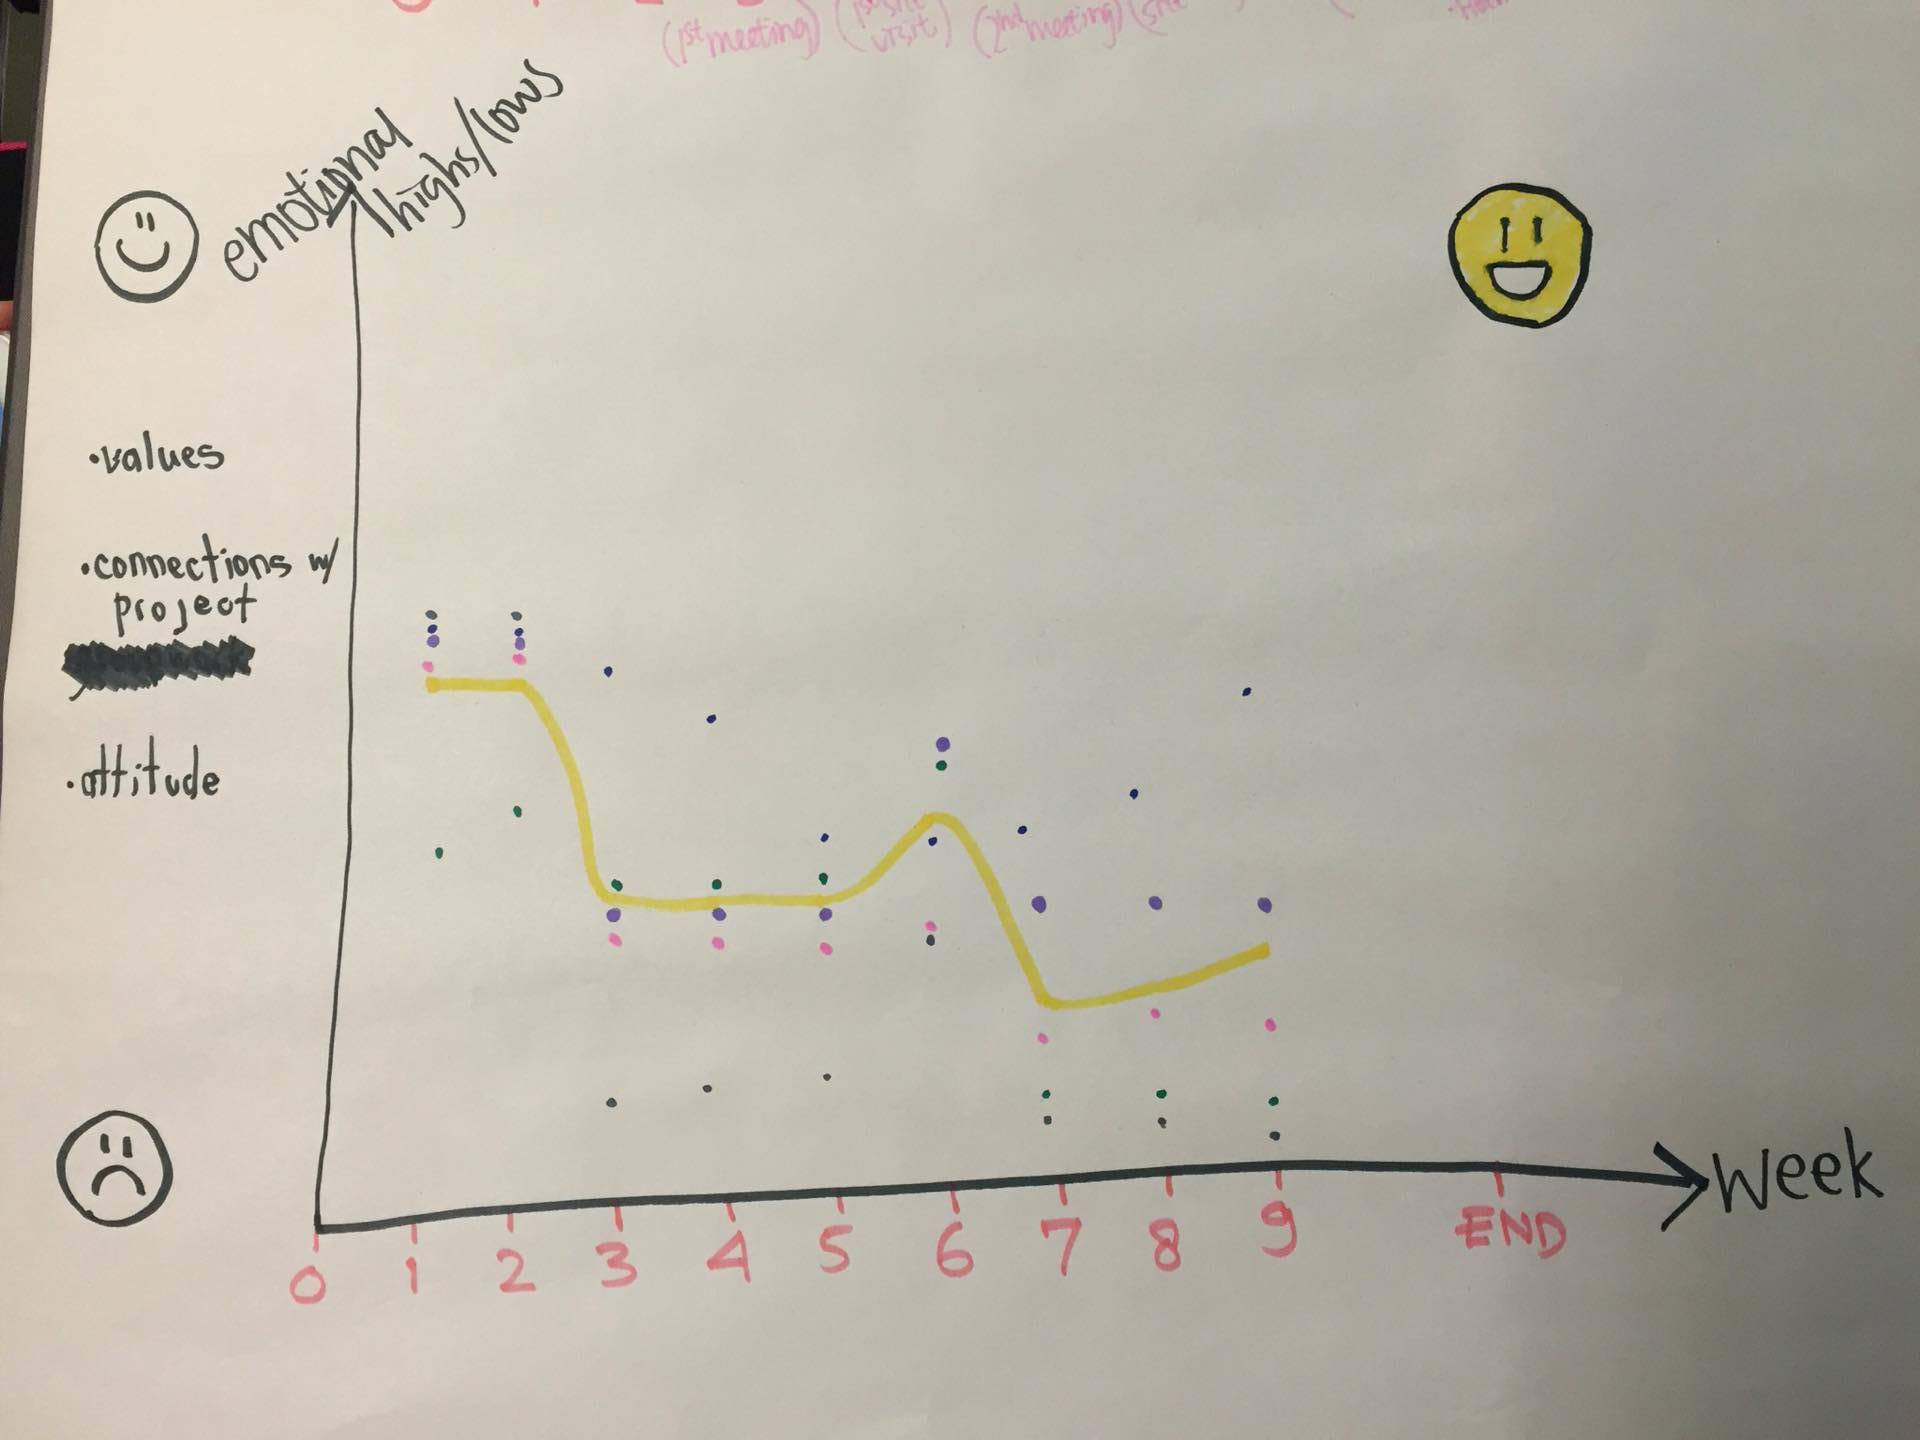
As you can see, our skills and knowledge increased quite linearly throughout the term, whereas our emotions tended to fluctuate throughout the term, based on significant events that occurred over time. We decided that the most significant skills we have gained included skills in blog writing, collaboration, communication, proposal writing and group work. As for knowledge, we agreed that we have gained the most insight through our CBEL project, concepts and theories presented in lecture and tutorial, as well as how to effectively collect and analyze data.
In addition, we also followed the data analysis spiral, as described by Kodish and Gittelsohn (2011). We started our data analysis by initial collecting data at our site visits at Killarney Community Centre. We wrote notes based on our observations and reflected on what our data meant, and then tried to describe and classify the data accordingly. The last step that we are still working on, and that we will be showing in our next blog post is our infographic to present a summary of all of our findings in a visual manner. Furthermore, we will be presenting our data in another way as well, by creating poster presentations to showcase our projects in the Nest, and also at the Hubbub event at City Hall on December 2nd.
Graph #1: Facts, Knowledge and Skills as a function of time
Graph #2: Emotional highs and lows as a function of time
So What?
Significance:
During our Moment of Significant Change workshop we were able to, for the first time, quantitatively and visually reflect on our progress throughout the term. It was interesting to create our graphs and see each individual’s’ opinions on how our skills/knowledge and emotions have progressed through the term. We noticed some specific points of significance throughout the term that influenced these two aspects. Significant moments included community partner meetings, group meetings, and site visits. Evidently, the majority of our significant learning, growth and emotional highs and lows occurred during hands-on actions, such as group meetings and site visits, instead of during our passive lectures. This really made us all think of how effective hands-on learning really is, and how actual real-life community partner, group, and site visit interactions ended up teaching us the most. We were also able to take what we learned from the graphs and apply it to our future goals. As for our skills and knowledge, we plan to continue this linear growth path, and reach our final goal (as indicated by the star at the top of the graph) by the end of the term.
After analyzing our emotional highs/lows graph, we can see that we all started the term quite optimistically. Around week 1, we received our placement in our specific CBEL project: City of Vancouver – Put Waste in its Place, and were all very excited as this was one of our top picks. You can also see that in week 6, we had our second community project meeting, which really got us excited about our project. It was a moment of significance, where we could see our project coming together and were able to refocus on the purpose and significance of our project. We fed off of the enthusiasm of our community partners and group members, and were able to better visualize our objectives and goals for our final project. After our 2nd site visit around week 7, we felt slightly discouraged by our results, as you can see by the drop in our emotion rating. We found that the new decals weren’t making a significant difference in the public’s waste behaviours, and thus felt discouraged on the effectiveness of our project. Eventually you can see our positive emotions have continuously increased since week 7, and we hope to end the term with extremely positive emotions (indicated by the smiley face way up high!).
In order to achieve these end-of-term goals, we decided to come up with some strategies for successful project completion that will help us to end the term with a peak in skills, knowledge, and positive emotions.
Now What?
Strategies for Successful Project Completion:
In order to successfully complete our Zero Waste project, our group will use a variety of strategies. First, we will continue using the effective group work and collaboration techniques that we have learned throughout the term to come up with a cohesive final project. Secondly, we plan to critically analyze our quantitative and qualitative data from our 3 site visits at Killarney Community Centre and determine future recommendations for improving public waste management behaviours in community centre settings. We will then compile all of our research and data into a final poster project to summarize our significant findings, which will then be presented at the Hubbub event at City Hall on December 2nd, as well as the LFS final project showcase. Finally, we plan to collaborate effectively with the Roundhouse Community Centre group in order to expand our data, findings, and recommendations through the use of multiple perspectives and collaborative teamwork. For our strategy, it is also important for us to remind our self why this project is significant and how it has potential to reduce the amount of waste going into our landfill. Valerie Segrest (2014) in her TedTalks reminds us the importance of our land because it shows us “who we are and where we come from”.
We have just finished all 3 site visits at Killarney Community Centre. Stay tuned to hear our final conclusions on the effectiveness of newly designed decals on community centre waste management behaviours!
References
Kodish, S., and Gittelsohn, J. (2011). Systematic Data Analysis in Qualitative Health Research: Building Credible and Clear Findings. Sight and Life, 25(2), 52–56.
Segrest, V. (2014) Food sovereignty: Valerie Segrest at TEDxRainier. Retrieved from https://www.youtube.com/watch?v=RGkWI7c74oo