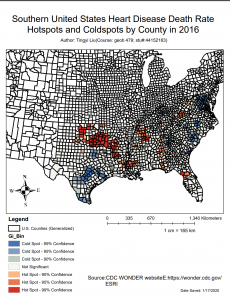
In this tutorial exercise, we used CDC Wonder Data and Model Builder to create yearly hot spot
maps of Heart Disease. I brought the data into an ArcGIS file geodatabase, then
create a model to process the data into individual feature classes
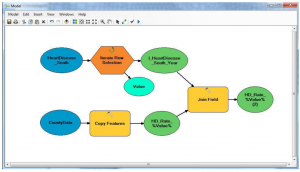 , one for each year and
a second model to perform hot spot analysis on each year’s feature class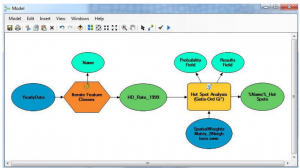 . Finaly we animate the
yearly hot spot feature class maps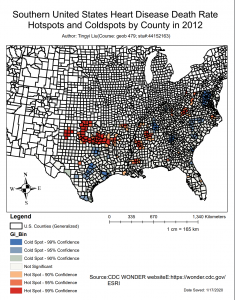
 .
.