My initial response to this week’s task of data analysis is an overwhelming sense of frustration and confusion. The only things included in the data are the song names, how many times a song was selected, and the name of the person who selected it. Other than seeing the popularity of the song by looking at how many times it was selected in the class, nothing else can really be said. I find it absurd that with just this small bit of data, we have to try to make profound conclusions about the political standing of our peers, what generation everyone belongs to, the personalities or preferences of the participants, or what similar traits ties us together. To do any of these deep analyses, data on demographics need to be included – each person’s age, cultural background, gender, sex, profession, etc. Almost nothing can be gleaned from a person’s name only, other than maybe their sex. Even then, it is tricky because some names are unisex, and others come from cultures that I know very little about. To do just a little bit of analysis, I would have to go to everyone’s blog to try and pull all this personal information from.
Even the idea of how popular a song is by virtue of how many times it was selected, is misleading. What does it mean to be popular? I am certain that everyone in the class selected their songs using a different criterion. A song that was selected multiple times, was it its tune that was appealing, its diversity in instruments, or something else entirely? Track 7 Johnny B. Goode was selected 19 times. Was it selected because it is a catchy, upbeat song, or was it selected because it sounds so different than all the other songs, being the closest thing to pop music on the Golden Record? The 19 people, including myself, who selected it, are we all of a younger generation when compared with the rest of the class? It is impossible to know why Track 7 is so popular with just this limited data set.
I suppose this is why data mining is so huge on the web and why social media companies, like Facebook, are in the business of selling personal information. All the data collected from clicks, mouse hovering, purchases, mean very little compared to what could be concluded if personal information behind each click was gathered.
In thinking about this week’s content on search engines, the only conclusion I can make here is that if a search engine was built using this data, then Track 7 would be the first search result to appear if someone looked up the Golden Record. Track 7 would seem to be the most relevant result to this search engine because it was selected the greatest number of times by the class, therefore seeming to be the most important in the topic of the Golden Record. Tracks 8, 4, and 27 would appear last. Only three people chose these songs, so they have less value.
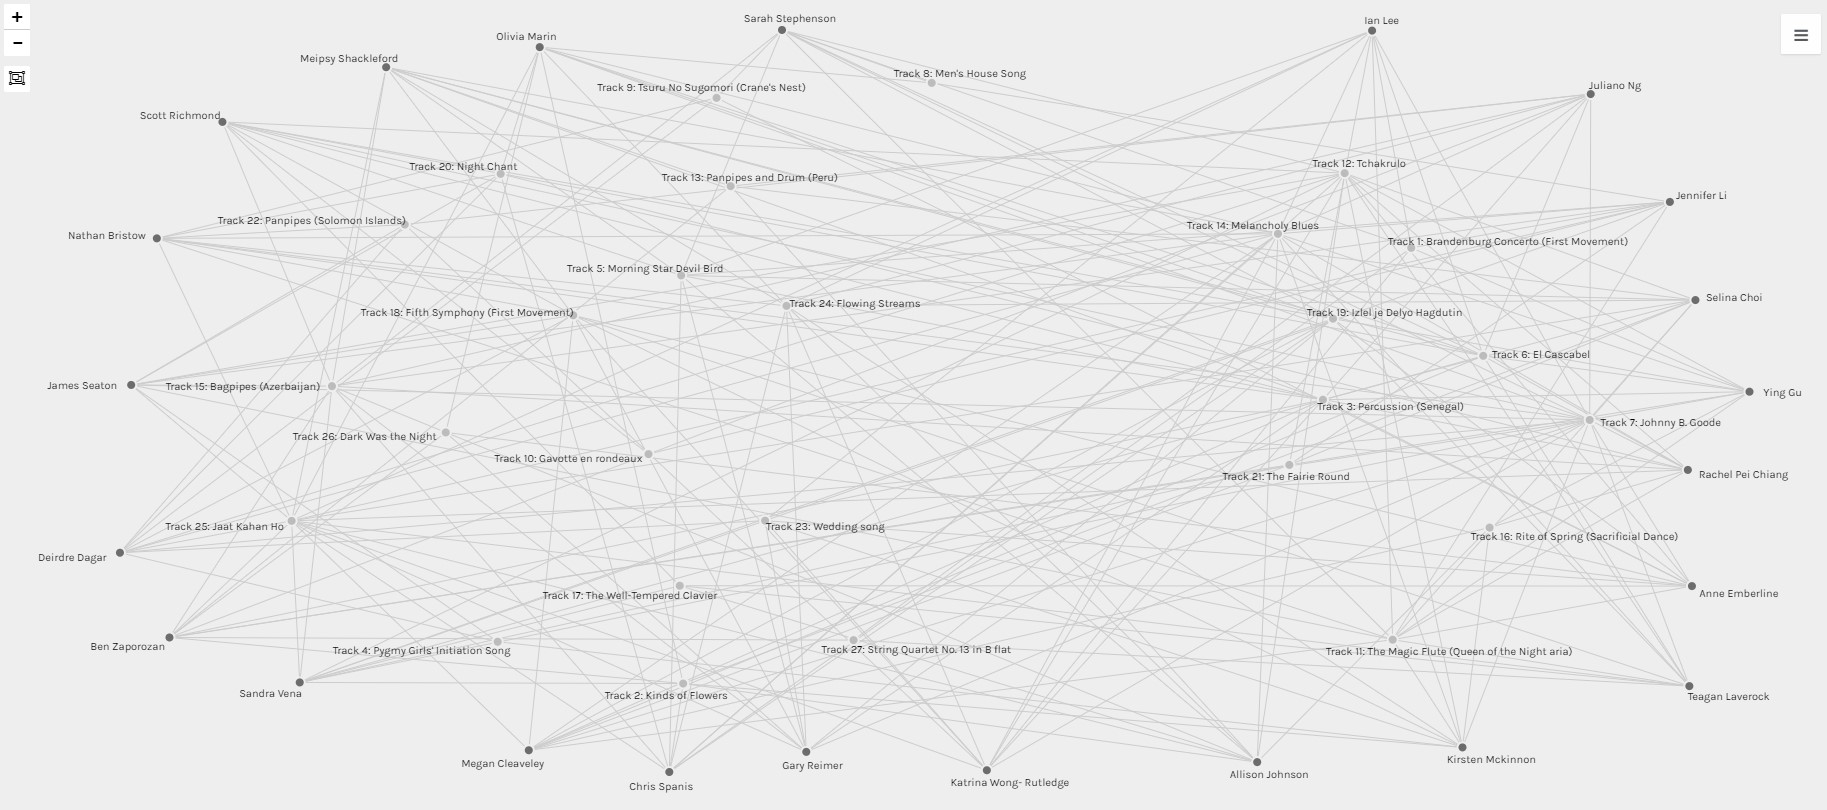
In my final attempt to make any conclusion at all from the data, I organized all the students in an outer ring and put all the songs in the middle. Because the only person I know in the data set is myself, I started to group the data to my own traits. I put people with Asian surnames near me and all other surnames on the opposite side. This was futile, of course, because just because a surname is Asian, doesn’t mean that that person grew up immersed in Asian culture. The person could have married an Asian person or could have been raised in the West since birth. I put my own song selection near my own name and all the songs that I didn’t choose on the opposite end as well.
The tracks that I chose and the total number of people who chose them are as follows:
- Track 7: 19
- Track 14: 16
- Track 12: 14
- Track 19: 11
- Track 6: 11
- Track 3: 11
- Track 11: 11
- Track 21: 7
- Track 1: 6
- Track 16: 5
Out of 23 students, a majority vote would be 12 students, or a song is selected 12 times. Out of my 10 tracks, I was in the majority three times (tracks 7, 14, 12) and in the minority seven times, which means that more people selected not to include the remaining 7 songs that I chose than people who did. This is not so bad considering that only 6 songs landed in the majority yes vote (tracks 7, 25, 14, 12, 11, 15), and I selected 3 out of those. So, what conclusions can be made here? I suppose this just says that I am average!
In looking at who had the greatest number of song selections in common with me, I anticipate that no one would have more than 5 songs in common with me. Musical taste is so personal and we were not restricted by any specific criterion to select the songs with that it is hard to imagine that any two people would share any more than 50% of their list. To my surprise, Megan Cleaveley and I chose 8/10 the same!
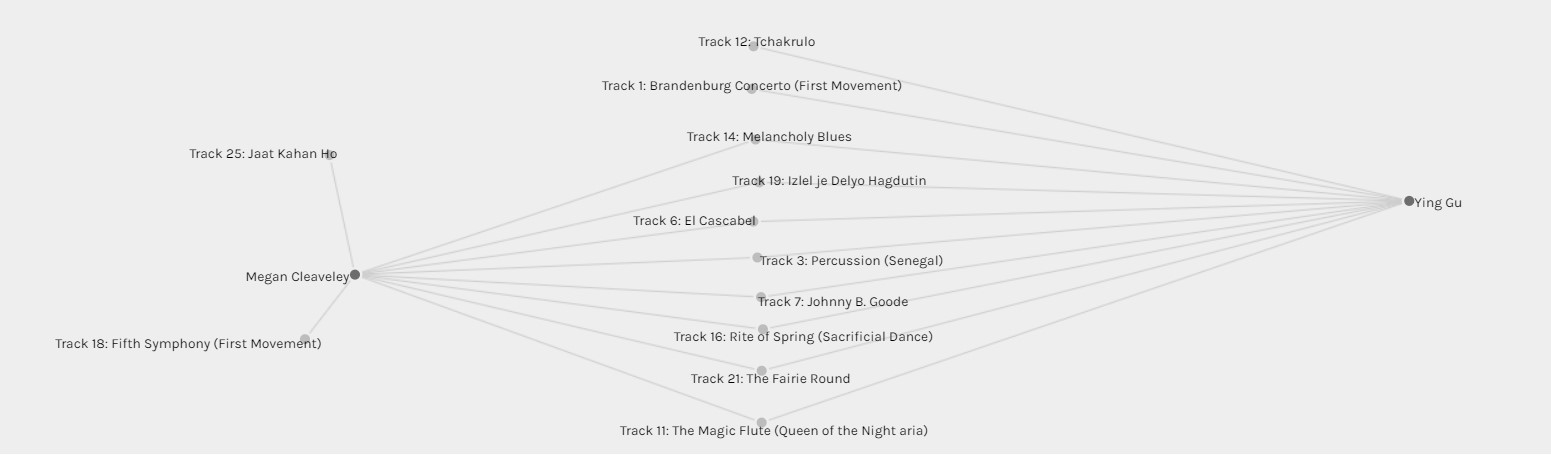
What does this say about the two of us? Nothing, because there is a lack of personal data to make conclusions from! Other than that we are both female, no other similarities between us can be gleaned from the data. If I selected my songs to be as diverse and different from each other as possible, perhaps she did something similar. Other classmates with 8/10 in common exist too, to my surprise, but only one other pair, Deirdre Dagar and James Seaton. The least number of songs in common between any pair of students is 2. I suppose the lesson here is that people will always share some similar ways in thinking, no matter how different they are. I realize, however, that the 23 of us are actually not that different if we all selected to take this course. This exercise, in finding commonalities between people, makes me wonder if this is how dating apps work. Is Megan my academic soulmate?