For any natural disaster, its risk is associated with two major components: hazard and vulnerability. A mathematical equation can be explained as: Risk = Hazard × Vulnerability
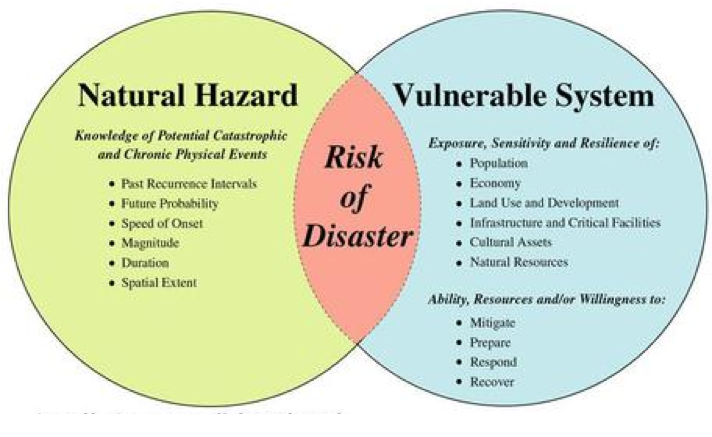
Fig 3. Risk of Disaster Diagram. Recreated by Brittany Brand from Wood (2011), USGS.
Part I. Hazard assessment
By definition, hazard means a potentially harmful agent. A hazard is an agent which has the potential to cause harm to a vulnerable target. In this study, we take into consideration several potential hazards including landslide, liquefaction, and tsunami hazard.
Landslide hazard
The steepness of slopes is the main influential factor of landslide hazard. The steeper the slopes, the higher the landslide hazard will be. The slope was derived from the Vancouver DEM data by using the Slope function in the toolbox. The slope layer was then normalized to a standard 0-1 scale through the fuzzy membership tool, where 0 indicates a flatter and safer place, while 1 indicates a steeper and more dangerous place.
Liquefaction hazard
The soil property varies as soil types change. Some soil types, like saturated or filled soils will have a higher hazard of liquefaction. By searching for soil science literature, we assigned different hazard scores for each soil type based on its property (Table).
Table 1. The earthquake hazard value of different soil types
| Soil type | Hazard score |
| Intrusive igneous rock | 0 |
| Volcanics, Mesozoic bedrock (Franciscan bedrock) | 0.25 |
| Quaternary (sands, sandstones, mudstones) | 0.5 |
| Quaternary muds, sands, gravels, silts, and mud. | 0.75 |
| Water saturated mud and artificial fill | 1.0 |
Tsunami hazard
Since Vancouver is a coastal city, tsunami impacts have to be considered. The areas which are along the coast and have a lower elevation are most susceptible to tsunami damages. We performed some basic geographic analysis to determine the coastal tsunami-prone area. First, we applied the buffer to map out 500 meters zone along the City’s shoreline (by setting the linear unit to 500m). Next, we identified the areas below 10 meters as tsunami-affected ranges through using the reclassify tool on the DEM layer. Under the equal interval classify method, we set the break value as 10 and changed other rows in the reclassify table to ‘NoData’. Next, we named the new layer as “Lowland” before converting it into a vector polygon. Finally, after clipping the buffer layer with Vancouver city boundary, we intersected lowland and shoreline. The final result indicates the regions that are most under tsunami threat after major earthquakes.
Overall hazard map
Finally, Weighted Sum is used in order to generate an overall hazard map across the landscape. The weight of each hazard factor is determined through the Analytic Hierarchy Process (AHP).
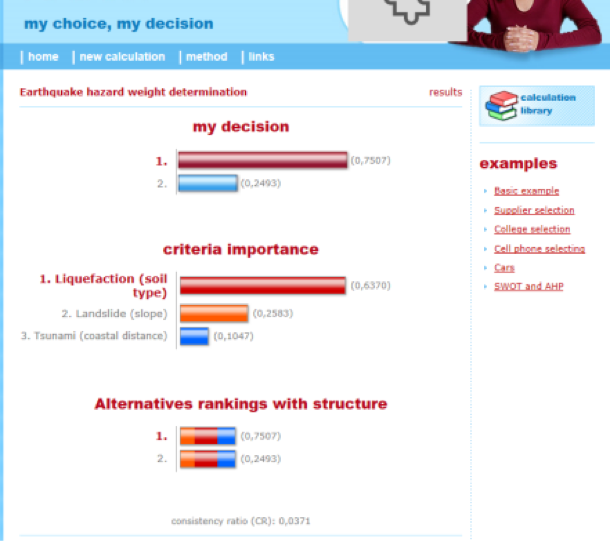
Fig 4. The weight assignment of earthquake hazard factors (including Liquefaction, Landslide, and Tsunami hazards)
Part II. Vulnerability assessment
By definition, vulnerability refers to a system or a unit’s inability to prevail against the effects of a hostile environment. In this project, we assess the vulnerability of different places through the following aspects: population density, land-use, hospital availability, and gas-line presence.
Population density
When an earthquake occurs, places with a denser population are more likely to suffer greater losses. The population density map was created and converted to raster format for later analysis. The population density underwent the fuzzy membership tool to convert the population to a standard 0 -1 scale.
Land-use
The damage and destruction caused by earthquakes are also associated with the land-use type. Basically, commercial areas are more vulnerable than other land-use types, since more properties are built, and more people live in the region. In contrast, open areas and bodies of water will be less vulnerable because there are not many facilities established there. The vulnerability score for each land-use type is summarized as the table below:
Table 2. Vancouver Hospital Locations
| Land-use | Vulnerability score |
| Commercial | 1.0 |
| Government and institutional | 0.7 |
| Residential | 0.6 |
| Resource and industrial | 0.5 |
| Parks and Recreational | 0.2 |
| Open area | 0.1 |
| Bodies of Water | 0 |
Hospital accessibility
Since injury treatment is a critical component of post-disaster relief, hospital accessibility is a key factor of the regional vulnerability index. We assume that areas within 2km of hospitals can get the quickest treatment after the strike of earthquakes. We created buffers of 2 km from each hospital location and converted the polygon layer into raster. The buffer-covered areas are assigned a vulnerability score of 0, and those areas not covered a score of 1.
Table 3. Vancouver Hospital Locations
| BC Children’s and Women’s Hospital | 4500 Oak St, Vancouver, BC V6H 3N1 |
| Vancouver General Hospital | 899 W 12th Ave, Vancouver, BC V5Z 1M9 |
| UBC Hospital | 2211 Wesbrook Mall, Vancouver, BC V6T 2B5 |
| Louis Brier Home & Hospital | 1055 W 41st Ave, Vancouver, BC V6M 1W9 |
| Mount Saint Joseph Hospital | 3080 Prince Edward St, Vancouver, BC |
| St Paul’s Hospital | 1081 Burrard St, Vancouver, BC |
| St. Vincent’s Hospital Langara | 500 W 57th Ave, Vancouver, BC V6P 1R8 |
Gas-line threat
Last but not least, earthquakes might damage the gas-lines and cause regional gas leakage and even explosions. We assume that areas within 500m of the gas-lines are under threat of the above mentioned (McMorran,Thielmann, & Sandborn, 2013).
Overall vulnerability map
Similarly, a final vulnerability map was created based on the above factors, and the weight of each factor was also determined by AHP.
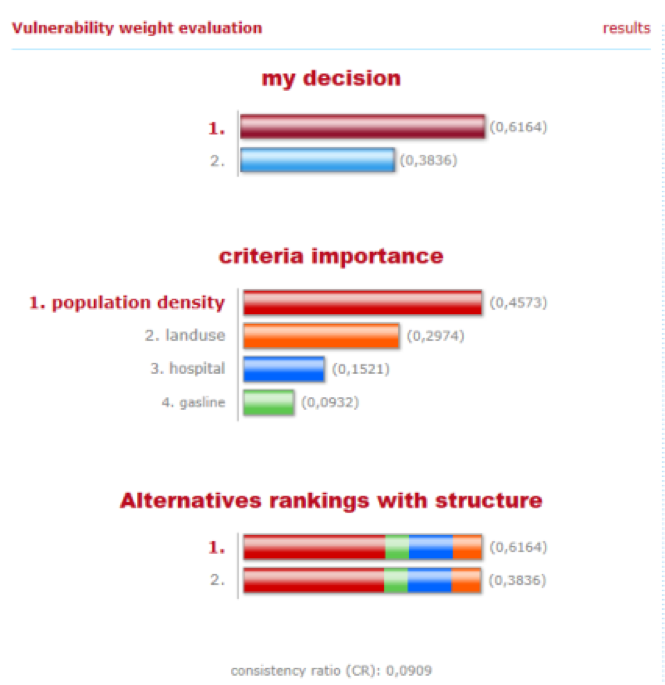
Fig 5. The weight assignment of earthquake vulnerability factors (including population density, land-use, hospital accessibility and gas-line)
Overall risk map
Finally, a risk map was created by multiplying the hazard and the vulnerability using the times function. Five classes of risks were determined using natural break classification (Low, Medium-low, Medium, Medium-High, High). The areas with the highest risk value are considered to be the most dangerous areas when an earthquake happens in Metro Vancouver.