Service Area analysis

Figure 3. Map showing the results of a service area analysis of EV ports away from facility in Metro Vancouver with a impedance of 48.17km.
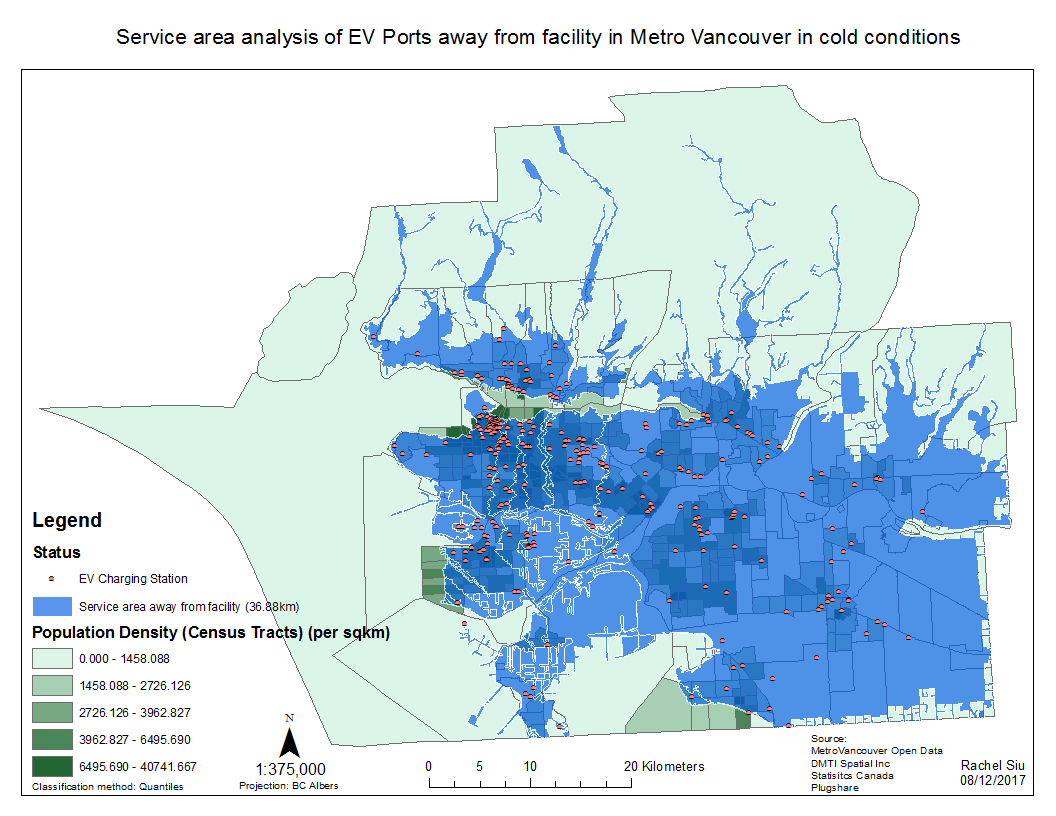
Figure 4. Map showing the results of a service area analysis of EV ports away from facility in Metro Vancouver with a impedance of 36.88km.
From these two maps, it can be seen that the coverage of existing EV charging stations already has a wide reach therefore there is no need to fret about driving electric vehicles around Metro Vancouver. In the service area maps, the white boundaries show the extent the service area. Due to a limitation in ArcGIS, not all boundaries are available in the maps; only the boundaries of the service areas in the top layers as deemed by ArcGIS are shown.
As electric vehicles on;y have approximately 75% of their full range in the cold, the service areas as shown in figure 4 are smaller. EV charging stations far east in Langley and Maple Ridge only have a reach until the east of Burnaby. Stations in Vancouver only reach until Surrey and Pitt Meadows. Stations in Surrey Central cannot reach the North shore or northwest Vancouver including UBC.
Multi-criteria analysis
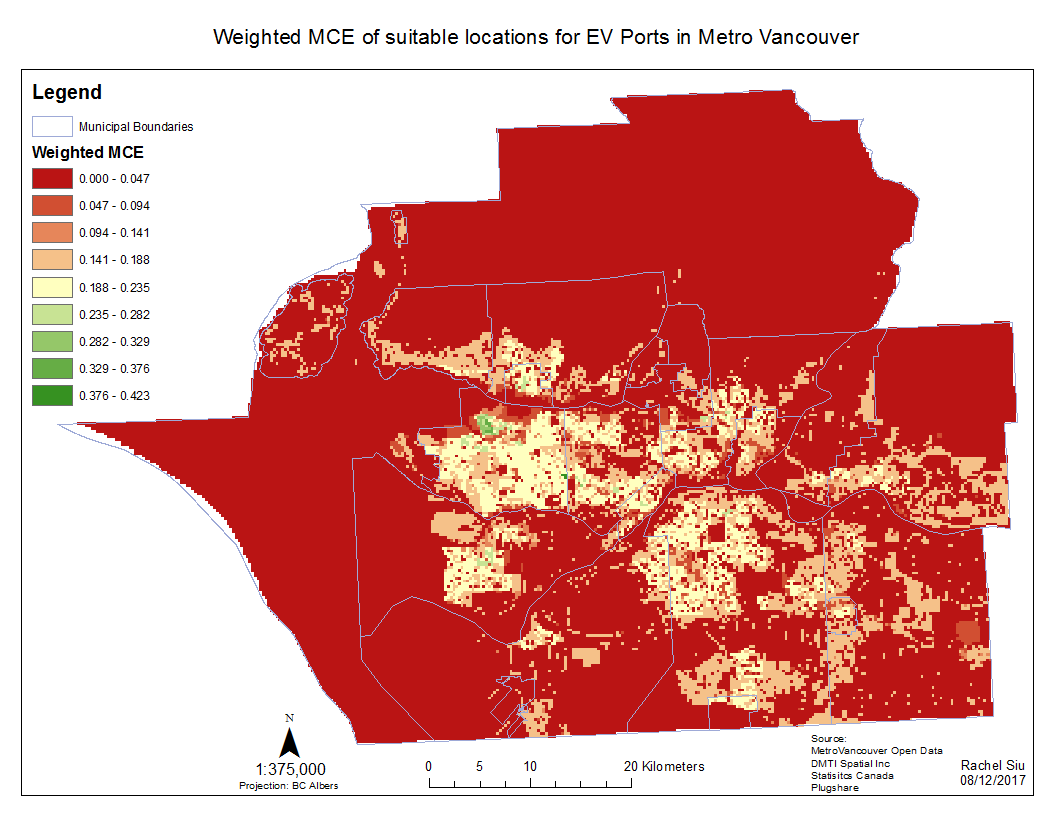
Figure 12. Weighted MCE of suitable locations for EV charging stations in Metro Vancouver
A multi-criteria analysis was conducted using the factors land use and population density as the number of existing EV charging ports factor was not feasible. This factor was removed due to the MCE results only showing up in the cells existing EV charging ports are. In future analyses, the location of existing EV charging ports should be reversed so suitable locations can be found with the further away from existing stations the better.
In the MCE, the red or smaller weight represents less suitable locations whilst the green or larger weight represents more suitable locations. As represented in figure 12, there are not many green or highly suitable locations in Metro Vancouver. The most noticeable green location is in downtown Vancouver where there is already a cluster of EV charging stations. The next outstanding suitability weight is yellow which encompasses the urban Metro Vancouver areas. These yellow areas are where new EV charging stations can be placed. By comparing the results of figure 12 to the location of existing EV charging stations in figure 1 and 2, new stations can be placed in south Surrey, and Richmond where the location is yellow and does not have a cluster of existing EV charging stations.
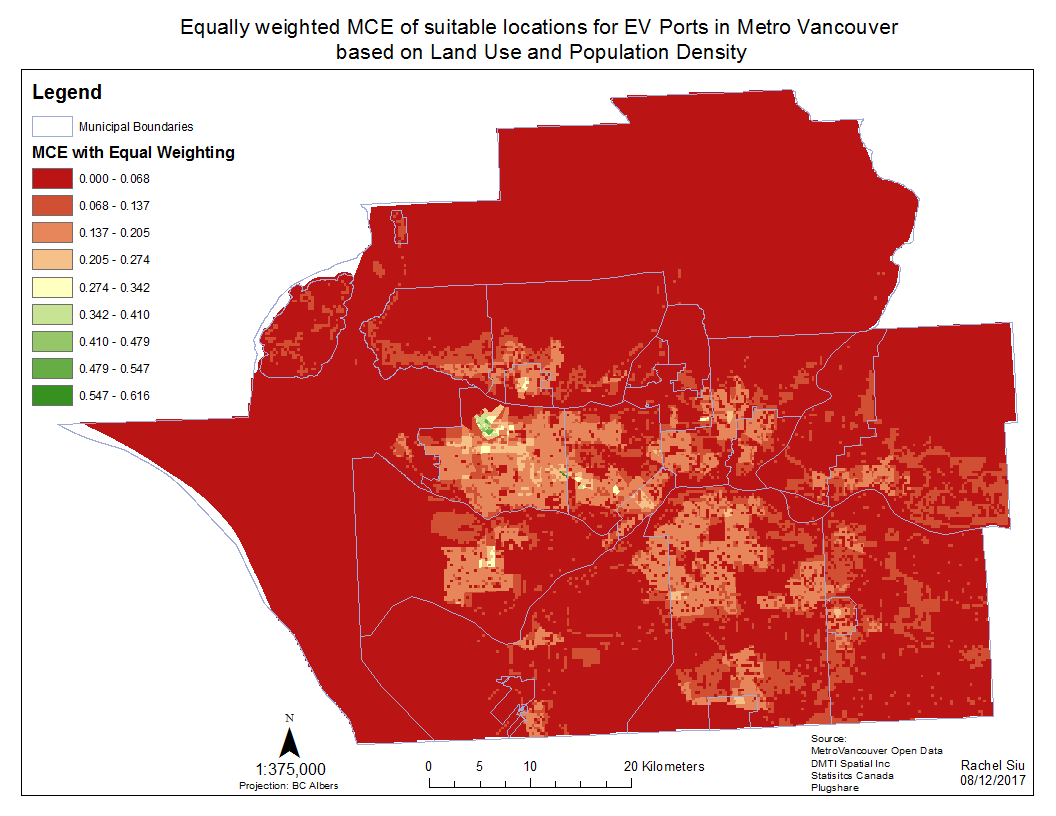
Figure 13. Sensitivity analysis using the equally weighted MCE of suitable locations for EV charging stations in Metro Vancouver
As with multi-criteria analyses, a sensitivity analysis was conducted to see if a different normalization approach would affect the results. In figure 13 equal weighting was given to the factors land use and population density so they were worth 0.5 each. Compared to figure 12, this lead to a decrease in suitable locations and an increase in less suitable locations hence the map looking awfully red. Other than the suitable colour change, the pattern of suitable locations is relatively the same.