By Aly Char, Connor Guilherme, and Patricia Mendes
Appendix
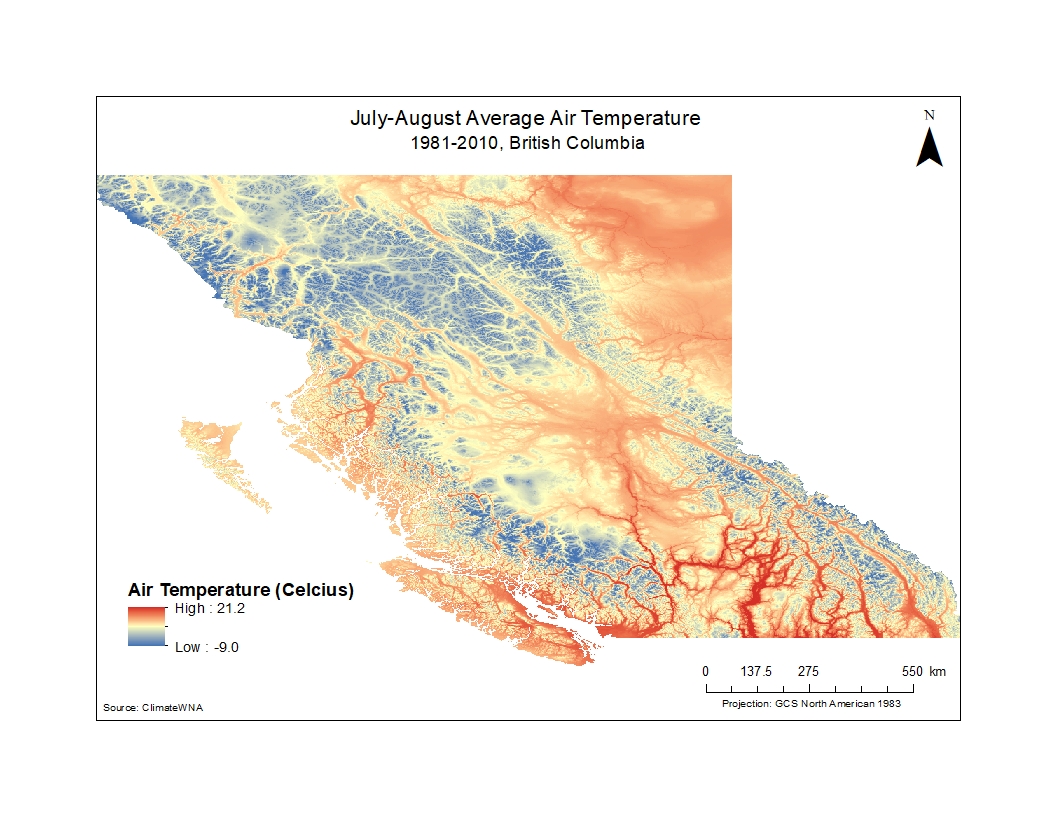
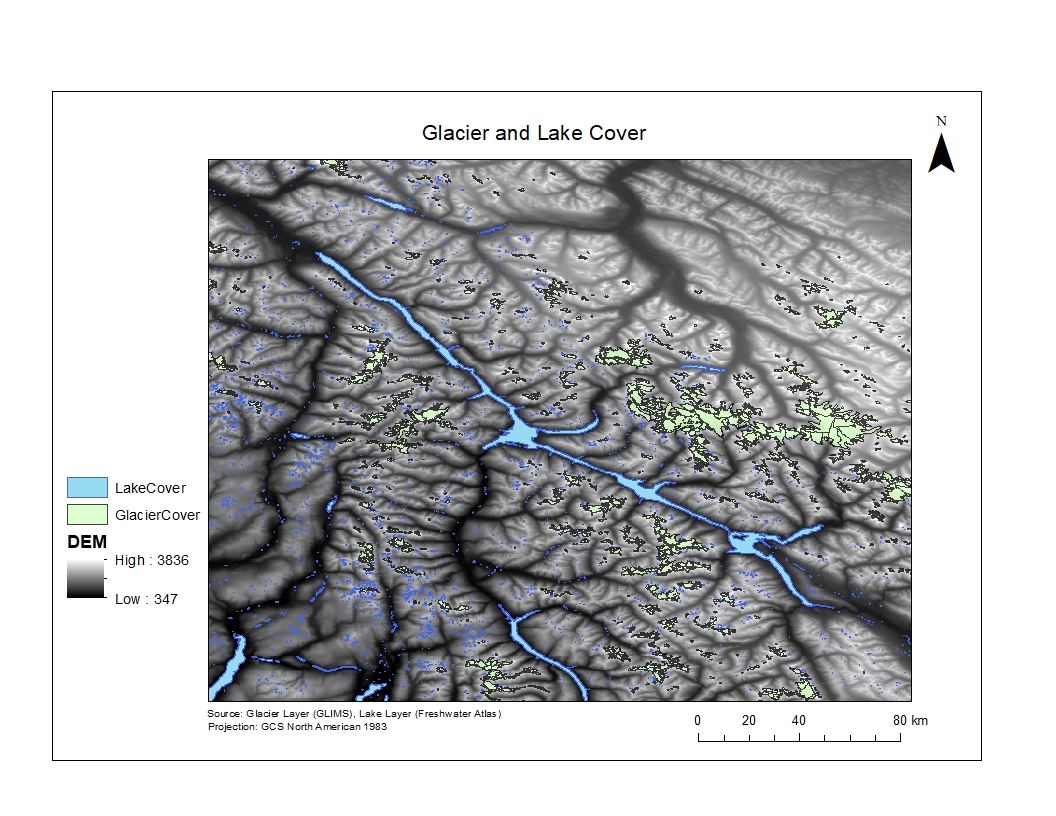
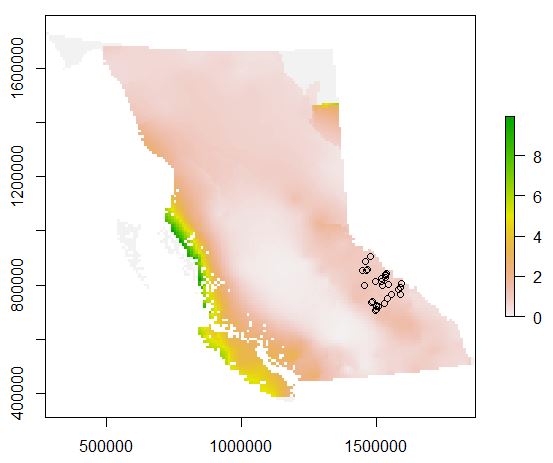
Figure showing average air temperatures for July through August from the period 1981 to 2010. Data obtained from Climate WNA.Figure showing glacier and lake cover for the entire study area. Glacier data is represented in green and lake data is represented in blue.Figure showing the k2 values for British Columbia. Black circles represent the fish point data. This map was produced in R (code courtesy of Dan Moore).