Data Collection
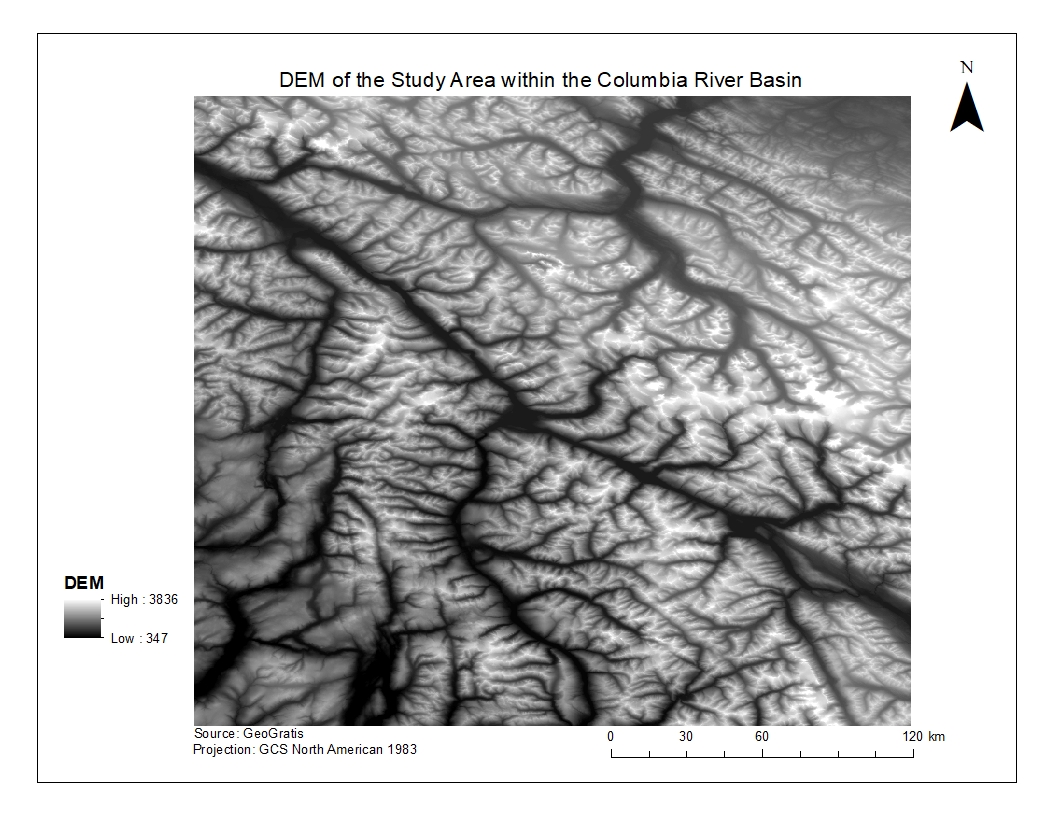
Our analysis was based on the Digital Elevation Model (DEM) of the specific region studied for this project in the Columbia River basin. This DEM was obtained from GeoGratis. Using the DEM, river networks were derived to delineate the watersheds associated with each fish data point collected.
The shapefile of the glacial cover data throughout British Columbia was collected from the Global Land Ice Measurements from Space (GLIMS) glacier database. The lake shapefile was taken from BC’s Freshwater Atlas. The historical climate data for the period of July through August was obtained from ClimateWNA BC, and the fish data was gathered using the BC Fish Inventory (view references page for data download links).
The above data was retrieved and clipped to the DEM representing our study area to discard any extraneous information.
Fish Inventory
As aforementioned, all fish data points were downloaded from the BC Fish Inventory. The data represented fish observations from 1977 to 1998 throughout the province. Within the study area, approximately 30 fish observation points from 1990 through 1998 were chosen at random to represent the distribution of fish in the Columbia River. A range of 1990 though 1998 was chosen for this study to keep the years of fish data consistent with years of the glacial data. A selection of 30 points was made in order to keep within the time limitations of this project.
Each fish observation point contained details about the type of fish observed, the date of the observation, the location, and general comments.
MWAT Model
The Maximum Weekly Average Temperature (MWAT) Model was used in this study to characterize the temperature regimes of fish species in the Columbia River basin. MWAT is the maximum, 7-day moving average of the mean daily water temperature from July through August (Parkinson et al. 2015). MWAT is calculated using:
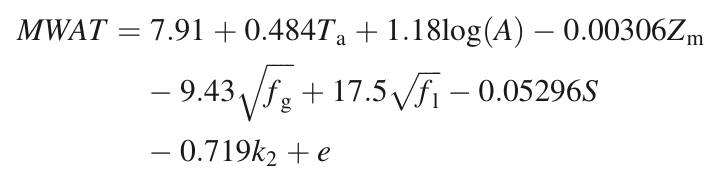
where Ta is the average July through August air temperature (°C), A is the catchment area (km2), Zm is the mean elevation of the catchment (m), fg is the fraction of glacier cover in the catchment, fl is the fraction of lake cover in the catchment, S is the channel gradient at the fish location, k2 is the index of the magnitude of the average yearly flood, and e is the prediction error (Parkinson et al., 2015). The prediction error adds up all the errors in all the variables and creates an error temperature range for the MWAT. For simplicity, our analysis ignored calculating the prediction error; however, it should be noted that as a result there are errors in our MWAT values that were not accounted for in the model.
Data Preparation with TauDEM in ArcGIS
Terrain Analysis Using Digital Elevation Models (TauDEM) provides users with a suite of tools necessary to extract and analyze hydrologic information represented in a DEM (It can be downloaded at this website: http://hydrology.usu.edu/taudem/taudem5/). We used the tool “Pit Remove” in TauDEM to prepare our raster data as opposed to the tools already available in ArcGIS because, unlike the “fill” tool in ArcGIS, TauDEM removes pits using the flooding approach to create hydrologically conditioned DEMs (Figure 1).
After removing the pits, a flow direction layer was created to represent the simplest model of the direction of water flow over the terrain.
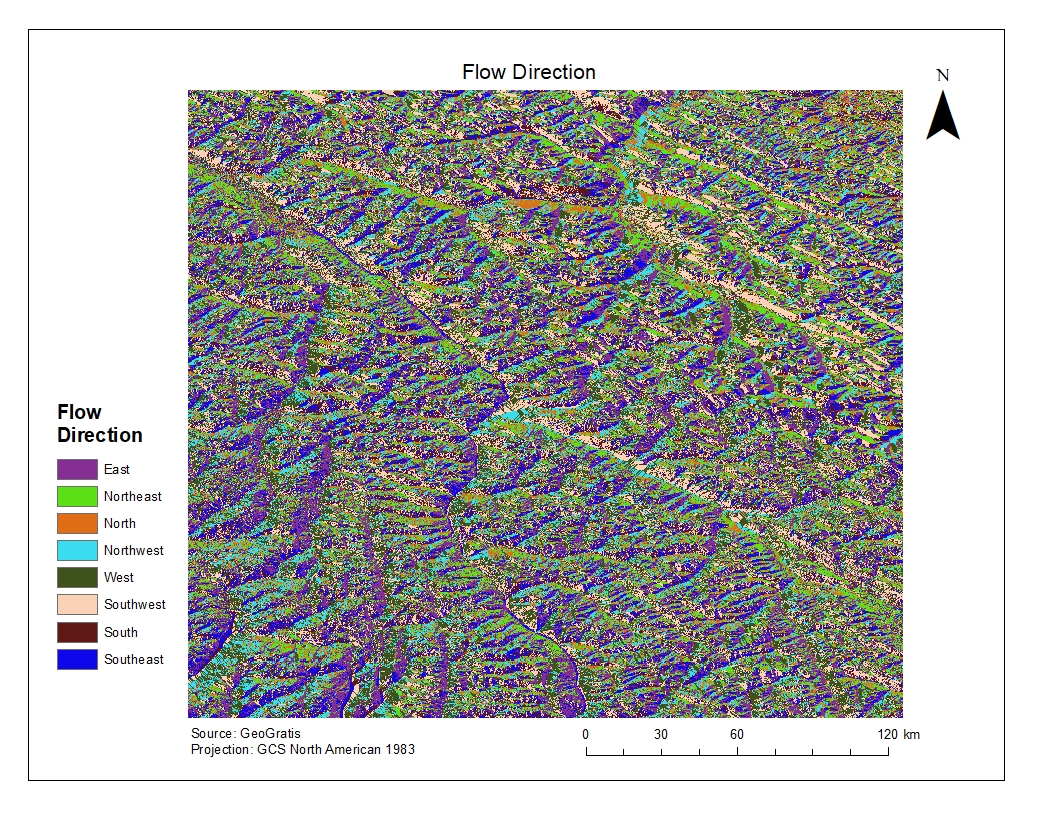
This layer was used to create a flow accumulation map that counts the number of cells that drain out of each grid cell based on directionality. From the flow accumulation layer, a stream raster grid was derived which was used to delineate the watershed upstream of each fish point later in our analysis.
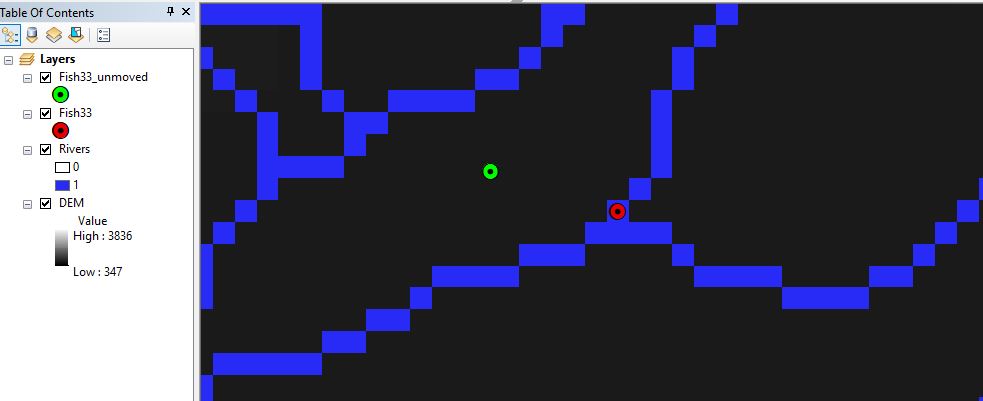
Since there are inaccuracies associated with fish data collection locations and DEM stream delineations, many of the fish points used were not located precisely on the streams obtained through the DEM. Therefore, TauDEM’s “Move Outlet to Stream” function was used to slide fish points downslope, according to the flow direction layer, until a stream was encountered.
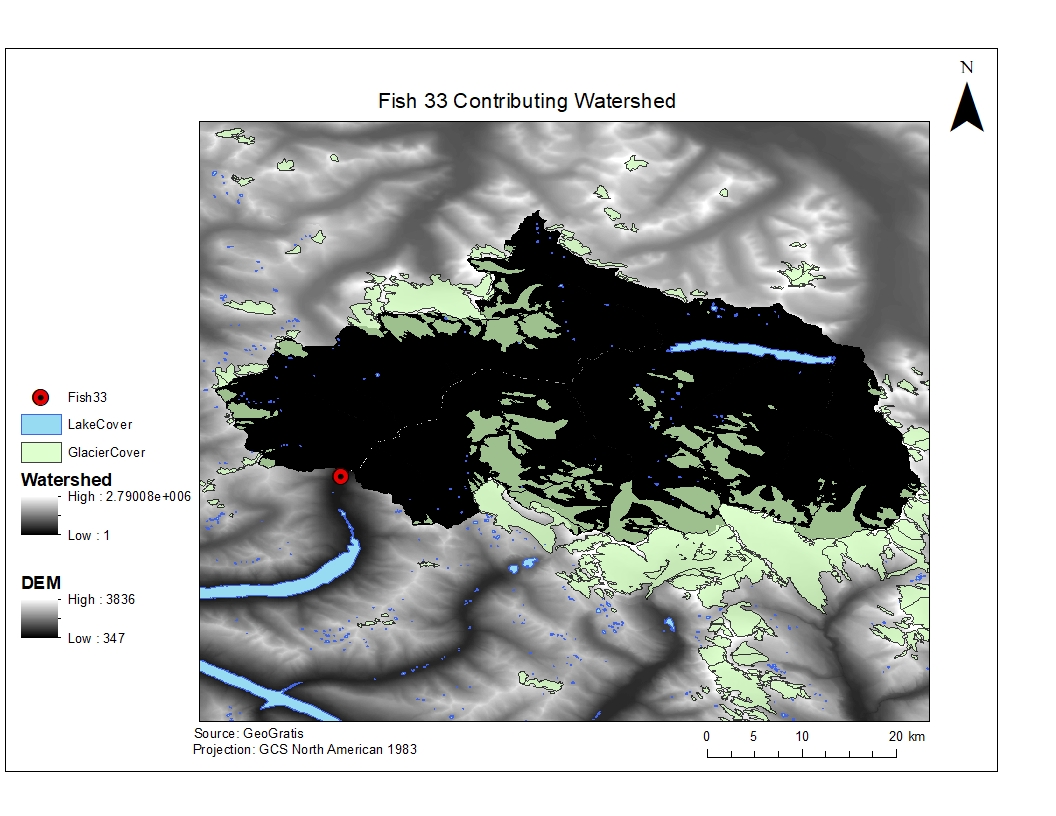
Because the MWAT model requires variables such as mean elevation, area, and glacial and lake cover to be calculated for the entire watershed that contributes to each fish point, TauDEM’s “D8 Contributing Area” tool was used to delineate the area of the watershed upstream of each fish point. Each fish point had to be run through this tool individually, so that each raster layer created would contain just the contributing watershed for that specific fish point. Doing so enabled extraction of all the variables needed for each fish species separately in RStudio.
Data Analysis
A script was written in RStudio that allowed extraction of the mean elevation of the contributing watershed, the average channel slope, the July-August average air temperature, and the fraction of glacier and lake cover within each watershed for each fish point. Additionally, a script provided by Dan Moore was utilized to obtain the k2 values for each fish point based on latitude and longitude. After all the data was compiled into a single file, the MWAT values for each fish species were calculated.