In order to predict how deglaciation and climate change will affect fish species in the Columbia River basin the current MWAT values found at the fish locations had to be compared to the predicted MWAT range.
Current MWAT
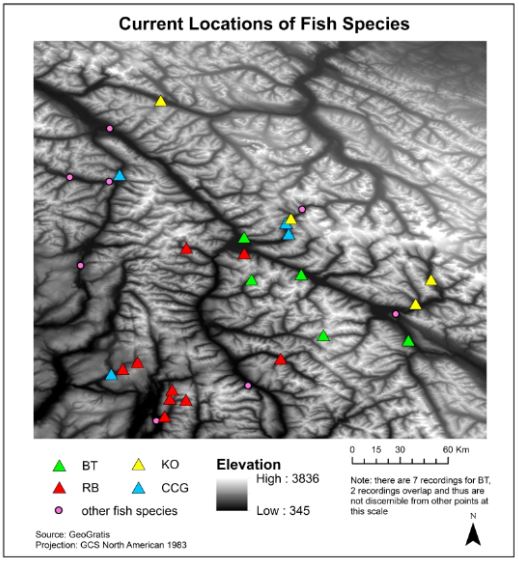
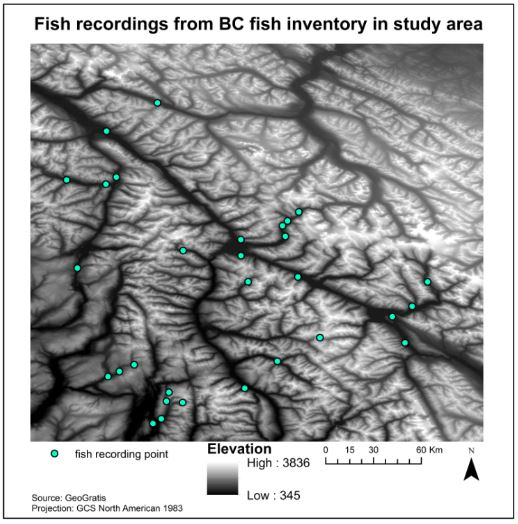
As there are multiple recordings of Bull trout (BT), Rainbow trout (RB), Kokanee (KO), and Slimy sculpin (CCG) for the data selected within the study area, these are the species on which further analysis could be conducted. There were eight other species found in the study area, but these species only had one observation recorded, so further analysis for these species would not be useful. The map below shows the distribution of the fish species within the study area.
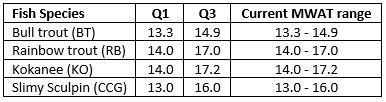
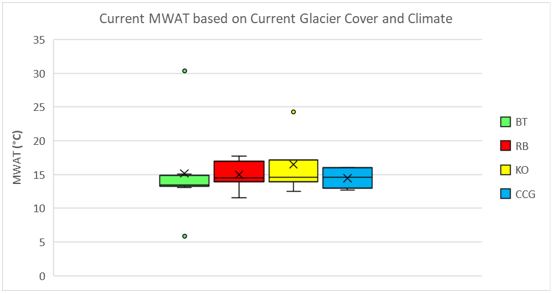
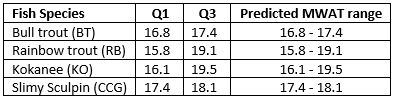
In order for the fish species to persist in the same locations that they currently inhabit the MWAT prediction value determined for the 2080s must fall within the MWAT range that the fish is currently found in. In this analysis we determined the fish species’ current MWAT range by defining the lower limit as the 1st quartile of the current MWAT data and the upper limit as the 3rd quartile of the current MWAT data. The table below shows the fish species’ current MWAT range as determined by the above method of analysis.
The boxplots below provide a visual representation of the data presented above.
Predicted MWAT
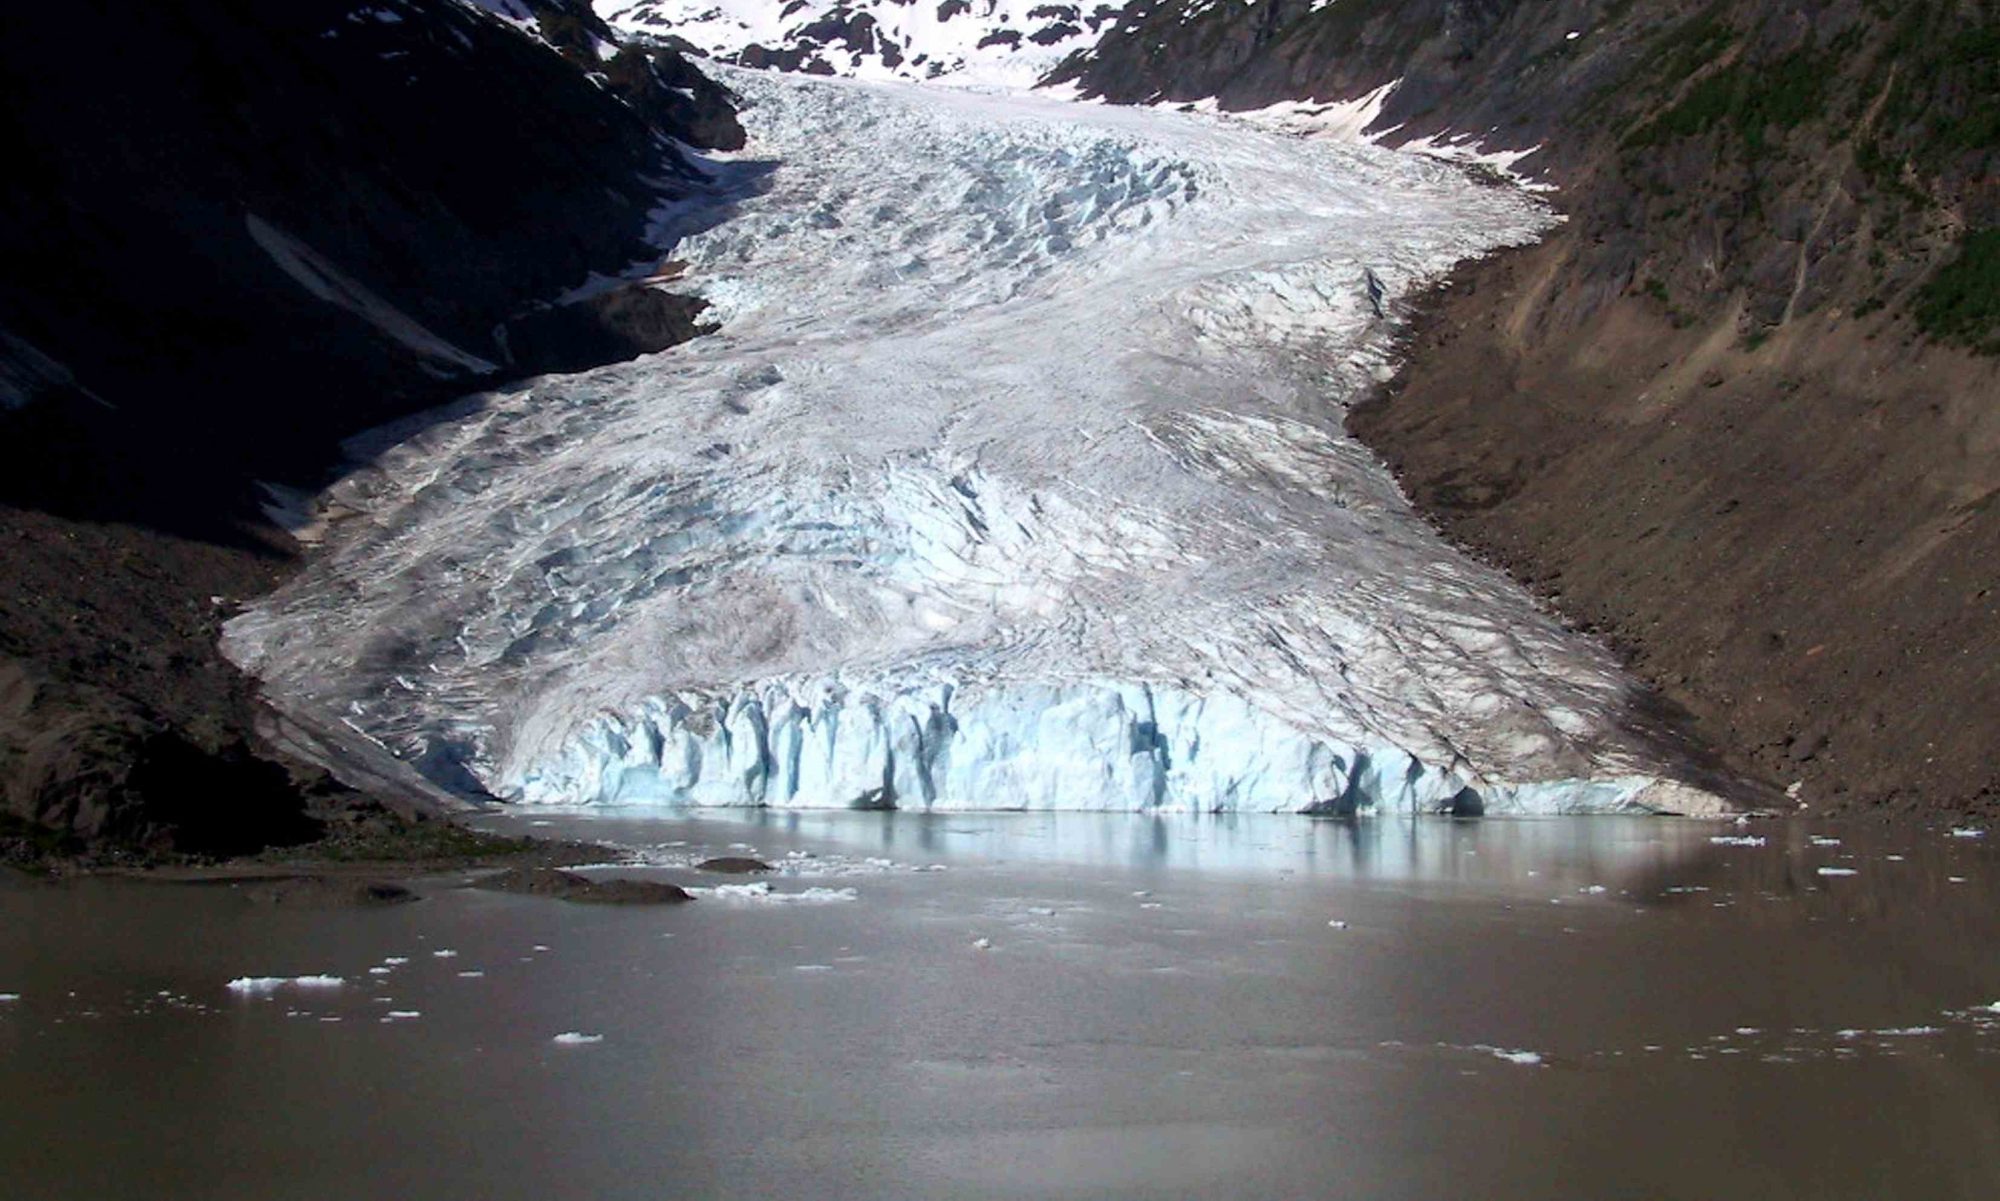
In order to determine the predicted MWAT range for the 2080s, the MWAT was calculated again for each fish point recorded. For the projection MWAT range calculation, each fish point recording was assigned a fractional glacial cover (fg) of zero and an average July through August air temperature (Ta) increase of 3.8°C. Fractional glacial cover was assigned zero for all points because it was assumed that all glaciers in the study area will have completely ablated. An average July through August air temperature increase of 3.8°C by the 2080s was determined by the University of Victoria’s Pacific Climate Impacts Consortium (PCIC) Regional Analysis Tool. From this PCIC tool, the median projected temperature increase was selected as the expected increase for the 2080s and was thus used in the calculation for the projected MWAT at each recorded fish point.
Once the predicted MWAT values were determined for each fish point the predicted MWAT range was determined in the same manner used current the current MWAT range determination. The table below summarizes the predicted MWAT range for the four study species based on reduction of fractional glacial cover to zero and an average July through August air temperature increase of 3.8°C.
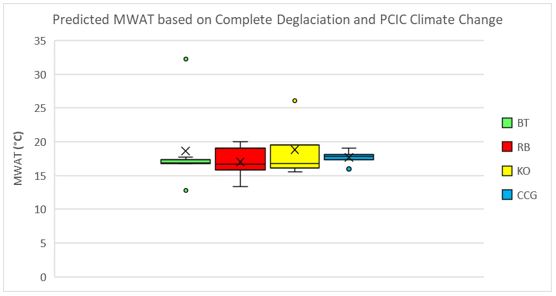
The boxplots below provide a visual representation of the data presented above.
Analysis of Results
Upon inspection of the boxplots, it can be seen that with complete deglaciation and a 3.8°C increase in average July through August air temperature the projected MWAT ranges increase to higher temperatures in the 2080s than current MWAT ranges. This is true for all of the locations that all four study species inhabit.
By considering all of the fish point recordings in this study we can further the prediction of potential species composition in the 2080s. The current and predicted MWAT for only 32 fish recording points from the fish inventory were analysed in this study. As described earlier there was one recording each for eight outlying species (CC, BB, CT, DV, EB, LKC, CRH, WCT), seven recordings of BT, nine recordings of RB, four recordings of KO and four recordings of CCG – totalling 32 total fish observation points. The current and predicted MWAT was calculated for all of the points, and each of these points can be used to map the locations where the four main study species (BT, RB, KO, CCG) could potentially inhabit currently and in the future.
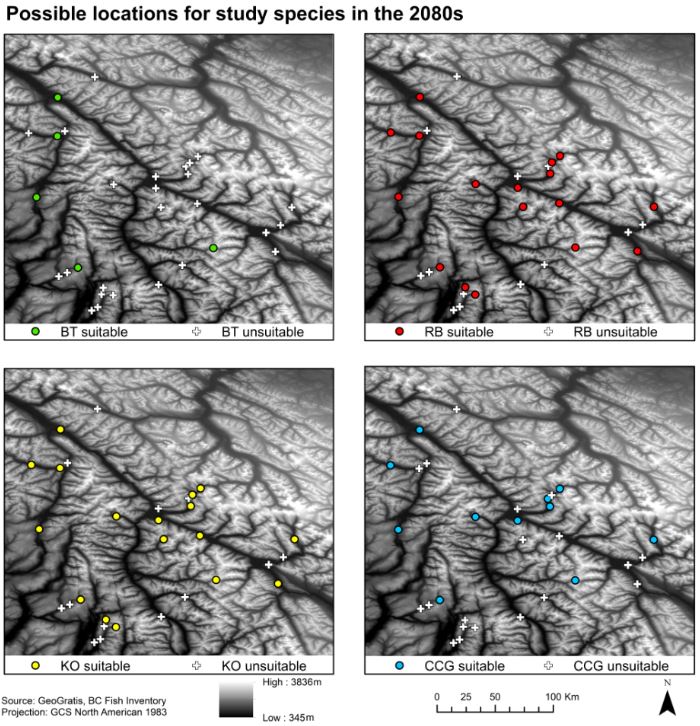
The maps below show the locations of the 32 fish observation points from the fish inventory (Figure 8) and the current possible and predicted locations for the four study species (Figure 9).
Based on the calculated MWAT values for the current conditions at each of the points represented in Figure 8, the map below shows the locations where each of the 4 main study species (BT, RB, KO, CCG) could potentially be found within the original 32 fish observation points.
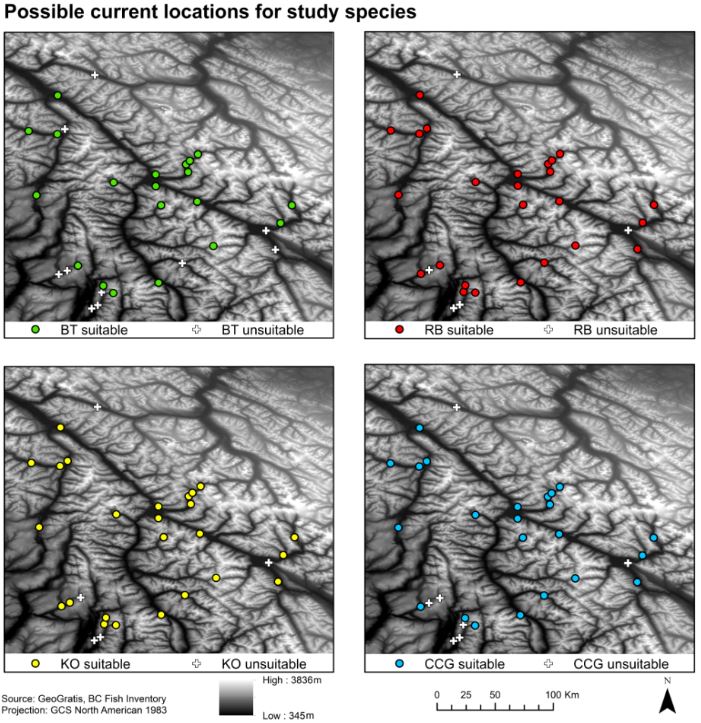
As Figure 9 shows, under current conditions the study species can inhabit most of the fish observation points within the study area. BT has the fewest number points showing suitable habitat within the study area, while RB, KO and CCG all share similar numbers of suitable sites. Figure 10 shows predicted suitable habitats based on complete deglaciation and predicted temperature increase of 3.8°C by the 2080s. A marked decrease of suitable habitat locations can be seen for all study species.