Discussion of Errors, Uncertainties, and Limits
Buffering Development Projects
While the research was conducted regarding the effects of different development projects overlapping wetlands, the buffers created around the development projects are still arbitrary. Due to the nature of wetlands and the scope of each proposed project, the buffers were established using best judgment about site-specific considerations and literature reviews. Finding accurate quantitative data of development projects’ effects on wetlands is challenging, which adds uncertainty to our analysis. As a result, the buffer sizes used to qualify total wetland lost may have been over-or under-estimated.
MCE Analysis
Weights & Normalization
When conducting the MCEs, the weights assigned to each variable are ultimately arbitrary since they were determined using best judgment, discretion, and literature review. Although the weights for the first MCE were directly based on the paper “A multi-Criteria Wetland Suitability Index for Restoration across Ontario’s Mixedwood Plains,” differences in the locations of the study areas may have implications for the weights and the normalization of the MCE inputs. For example, using the slope classification resulted in much more suitable area in Ontario than for this analysis in BC, and the slope raster for BC had a wider range of variability than that of the study area in Ontario. In addition to the input criteria and their respective weight, normalizing the inputs to a range of 0-10 results in another source of uncertainty. Aggregating the data into classes can mask the true influence of the criteria over its entire range on wetland suitability. However, because the paper is peer-reviewed, uncertainty is reduced.
Soil Criteria
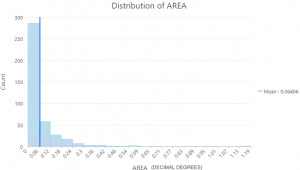
Additionally, the soil data used in the MCE was outdated. Soil Landscapes of Canada (SLC) v2.2 was used rather than the latest v3.2 because v2.2 contains the latest complete coverage of Canada (i.e. including areas outside the agricultural regions of the country). The SLC v3.2 component information is restricted primarily to the agricultural areas of Canada, although Alberta, Nova Scotia, and Prince Edward Island have component, soil name, and soil layer data for the entire province beyond the agricultural areas. Additionally, there were some soil polygons with drainage set to “#” which signifies non-applicable. These polygons were arbitrarily set to 5 when reclassifying the data to have complete coverage in the MCE, resulting in uncertainty regarding the accuracy of the normalized layer. Specifically, there were 406 soil polygons out of 2849 in all of BC that were assigned “#” for soil drainage. These polygons were largely distributed along the west coast of BC. However, most of these polygons are small, as shown by the below distribution of shape area (with units being decimal degrees) for the layer containing only soil drainage polygons with no data.
Figure 12. Distribution of Area chart. The areas correspond to “no data” soil polygons.
Furthermore, by erasing the soil layer to the lakes layer and then merging the two layers, any no data areas overlapping with lakes would be replaced with a reclassified value of 0 (lakes are considered undesirable for wetland creation).
Groundwater Level Criteria
Another source of uncertainty is the groundwater level raster created using Kriging. Using a total of 119319 points, a continuous raster layer was created for groundwater level. Because these static groundwater level point measurements are heavily concentrated in lower BC and sparse in the North, the resulting implications prediction may be less accurate in areas where there are disproportionately fewer points. Additionally, because the study area, being the entirety of BC, was so large, creating a single prediction surface has its limitations. For example, other influences such as differences in precipitation, presence of infrastructure, and elevation may all be factors controlling groundwater in a given area that is being predicted based on the water level in another region. To help account for this uncertainty, co-kriging was conducted using point elevation, assuming that elevation and groundwater level are correlated. Co-kriging enables better prediction by incorporating the direction and orientation of the second dataset in addition to the distance and relation of nearby points in the first dataset. According to a representative of Natural Resources Canada, the aim is to improve access to and quality of the raw data. In the future, this analysis could be re-run with improved groundwater level data.
Agriculture Criteria
The Agricultural Land Reserves (ALR) layer, used to identify agriculture, also added an element of uncertainty given that it is not representative of all agricultural land in BC. The ALR is land that is zoned by the province to prioritize agricultural use; farming is encouraged and non-agricultural uses are restricted (Provincial Agricultural Land Commission, 2014). Approximately 4.6 million hectares of agriculturally suitable land are protected and used for agricultural purposes within the ALR (Provincial Agricultural Land Commission, 2014). While all uses of the ALR are reserved for farming and agricultural use, there is also farming that occurs on land that is not deemed as the ALR. This may include private farms or smaller-scale farms, urban farms, community gardens, or more. This limitation implies that more suitable land should have been identified in the reclassified agriculture input layer. However, the majority of agriculture does occur within the ALR, therefore, the uncertainty in this criteria does not invalidate our data. Overall, this results in an underestimation of the extent of suitable land-based on agriculture.
Area Measurements
After aggregating the weighted and equally weighted optimal locations, the measure tool was used to find the total area in km². There may be some systematic and random errors that persist when measuring, rounding, and calculating our totals. Given the resolution of the raster, the measurement may not be accurate to its true value. To ensure maximal accuracy given this limitation, these areas were measured several times.