With the normalization of each variable complete we were able to perform the Multi-Criteria Evaluation (MCE).The following table displays the weighting of each variable for our final MCE map:
| Factor | Weight |
| Slope | 0.4 |
| Curvature | 0.05 |
| Aspect | 0.15 |
| Elevation | 0.25 |
| Wind | 0.15 |
Slope was given the highest weight because it is the most influential factor when considering slab avalanche formation. Elevation was second highest because sufficient amounts of snow would not be able to accumulate at lower altitudes. Wind speed and aspect were given equal weighting because they are highly affected by climatological conditions. While curvature was essentially disregarded, the reasoning behind this decision will be explained in the discussion. Once this weighting had been established we were able to produce our final maps. The first two display our entire study area, the first one displays hazardous avalanche terrain in the Winter while the second displays the same information but for the Spring.
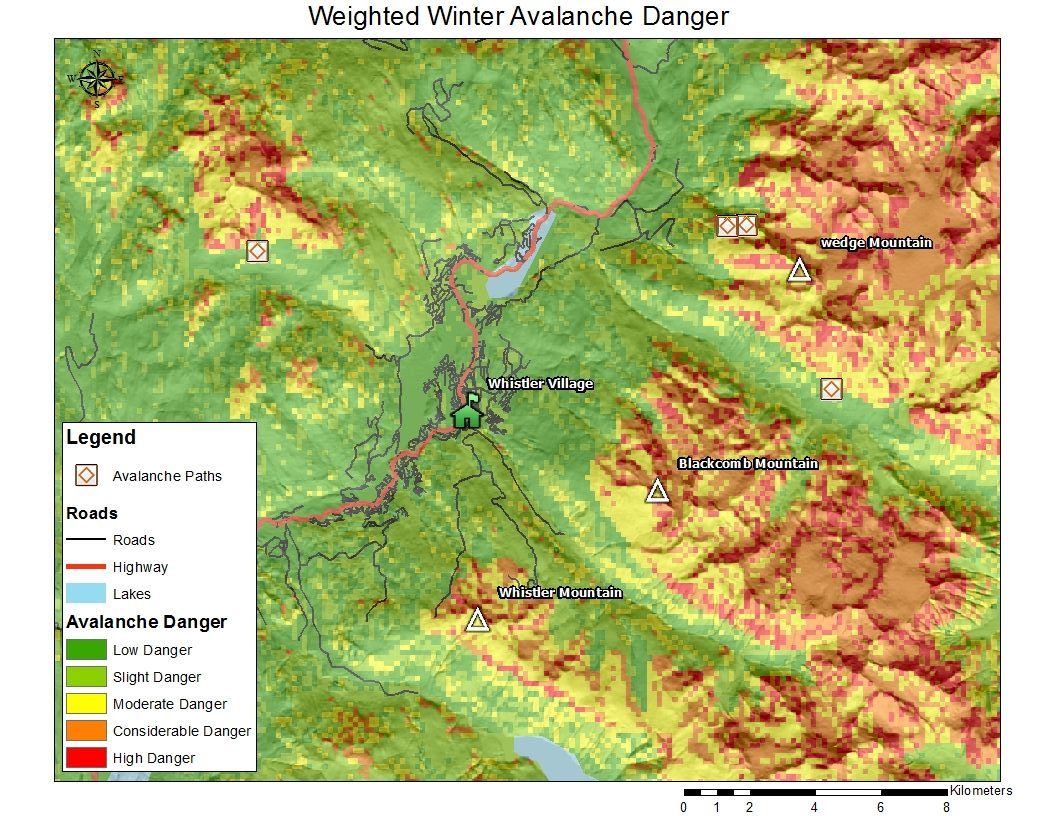
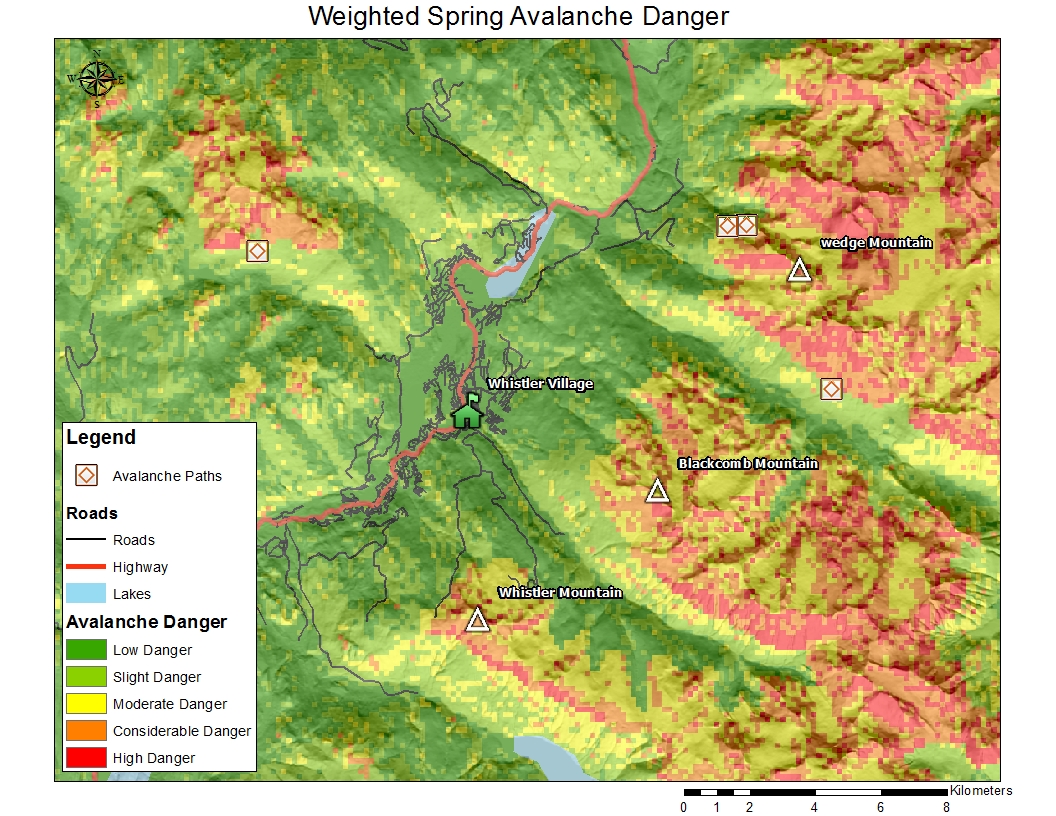
While these two maps are quite similar, there are some differences that should be noted. First of all there is far more regions of Considerable Danger in the Winter map compared to the Spring map. This is likely due to the fact that there are more Northern and Eastern facing slopes in our study area. In particular the region to the Northeast of Wedge Mountain as well as the entire bottom right portion of the maps show higher levels of danger. The second area is of particular interest because it is part of the Whistler and Blackcomb backcountry. The next two maps are closeups of this backcountry region in both Spring and Winter conditions.

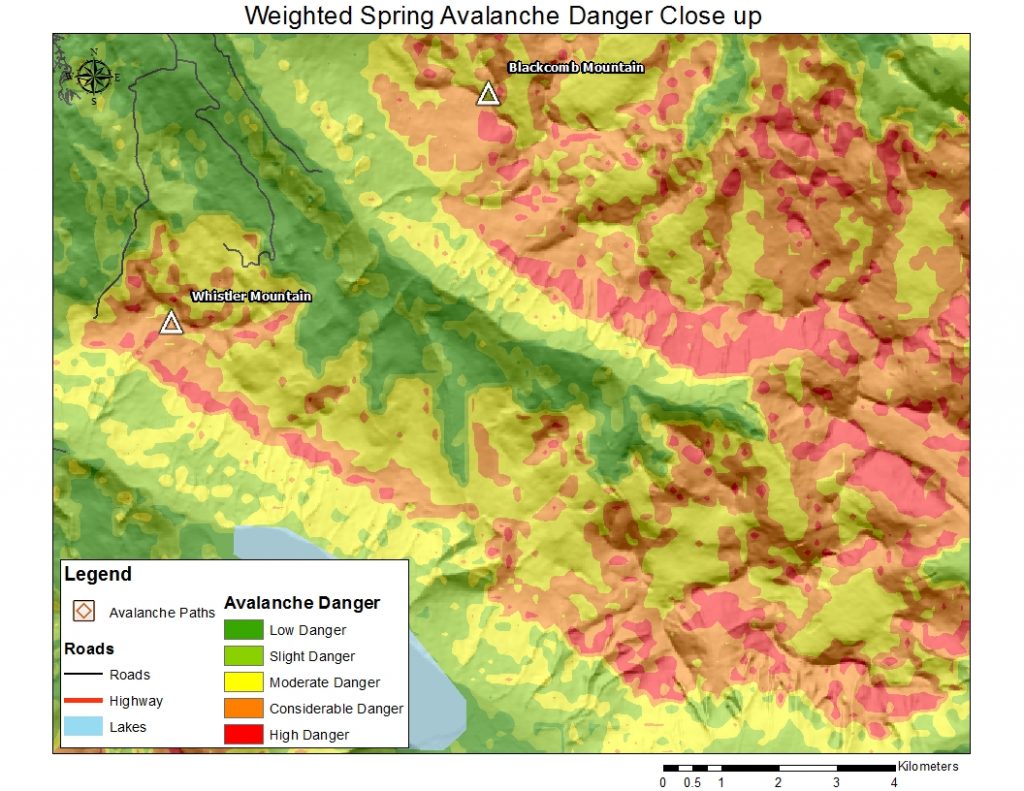
These closeups clearly display how the different danger classifications of the slope aspect from Winter to Spring affect the results. The Northern and Eastern facing slopes are more prominent in the backcountry leading to higher danger classifications in the Winter. Also as the closeup was performed the resolution of the DEM became extremely noticeable. To remedy this issue we changed the display from a nearest neighbour display to a continuous display. This merged each pixel together creating a much smoother raster display.
It should be noted that these maps are general representations of possible avalanche terrain. In particular almost all areas above the elevation of 1750 meters are classified as moderate danger. This is due to the fairly high weight given to elevation when the MCE was calculated, while this is not incorrect it creates a map that displays many dangerous regions yet some of them may not be prone to avalanches. Other issues with our data will be explained in the discussion section.