
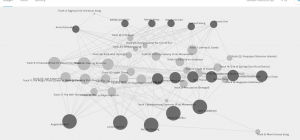
My understanding is that Group 3 (Natalie, Delian, et al) are the most well connected group. They each have a list of song choices that connects them to more individuals in more ways than the people in Groups 2 and 1. I am making this assumption based on the graph below which I created by selecting as Source – ‘Curators’ and according to – ‘Sum of Communities’. We can see that the circles associated with each individual’s name are sized according to the size of community they relate to. Group 3 contains curators with the largest sum of communities, Group 2 the second largest and group 1 the smallest.
But what does this mean? Do the individuals in Group 3 have a knack for selecting songs that will create more pathways between them and other members of this class? Is it a reflection of their taste in music? I wondered if their lists of songs contained more of the most popular songs than those of us in Groups 2 and 1.The following graph groups song based on how many curators chose that track; with the size of the circle reflecting its popularity.
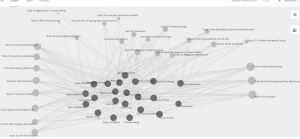
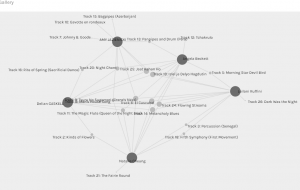
The 3 most popular songs are ‘Melancholy Blues’, ‘El Cascabel’, and ‘Fifth Symphony (First Movement)’. Four individuals in Group 3 have selected 2 or more of the the 3 most popular songs. However, Amy did not select any of the 3 most popular tracks. Amy is an outlier in her group in that she has less songs in common with the others in her group (see graph below). This suggests that selecting the most popular songs does not mean that you will necessarily be the most connected person in the class, but it probably helps.
Interestingly, in Group 2, no one selected the ‘Fifth Symphony (First Movement)’ and only 2 individuals selected both of the other most popular songs, while in Group 1, 2 individuals selected all 3 of the most popular songs. I might hastily conclude from this that selecting the most popular songs in your list does not in and of itself mean you will be well connected to the rest of the group. I could of course be wrong about all of the above, which would be an interesting outcome to, saying something, as it would, about how we can be seduced by graphs and our own vague understanding of them.
What to make of the political implications of such groupings and all that is unsaid in the graphs? We know that the criteria individuals used to choose songs for Task 8 would be quite idiosyncratic and I think on one level it would seem quite random. At the same time, we do know quite a bit about the people that chose these songs. We know that they are pursuing a Master of Education Technology degree through a university in western Canada. We might conclude from this that they have an interest in education and are educated to at least undergraduate level, they are at least somewhat technologically proficient and given which university they are attending more likely than not they probably lean a little to left on the political spectrum (This being an online degree, with individuals from all over the world attending, this might not hold up quite as well compared to a similar course pursued in person at the university). With the above information we might surmise that the individuals choosing the songs would want to exhibit a sense of fairness in their selections. One way in which they might make an effort at fairness would be to choose songs that represented peoples and cultures from different parts of the world. There are 6 pieces of Western classical music on the original list. I bet even the most hardcore classical music fan would avoid picking more than 3 of these in the interest of fairness.
When it comes to making use of networks and identifying how groups connect it can sometimes seem that there is less effort made to understand why these connections exist compared to figuring out how best to exploit these patterns. We do not always understand why certain pathways are created, but we do know that under certain conditions these pathways are the likely outcome. We see this done on social media platforms where political ads and campaigns run. Messages and images are constantly tweaked and monitored in order to figure out which combination of spin makes something most viral. In our example we might experiment by reordering the original list of songs, or we might choose to highlight the fact the song was composed by a male or female person. Does the order in which songs are listed, or highlighting the gender of the composer, impact which songs are more likely to be selected? It might. By applying this type of methodology we learn how people are influenced and the pathways that are created by their choices. Lessons learned from how networks are formed in this type of assignment might on another level be used to help with the dissemination of knowledge or persuasion of people in relation to, for example, vaccines and pandemics, or it could be used to encourage people to share conspiracy theories.