A number of the sources I used in my research paper had great images, but could not be easily integrated into the paper. To account for that I’ve decided to include the most informative images here along with corresponding parts of the paper. While this is not the full extent of my research paper it offers an introduction through visuals to the topic. 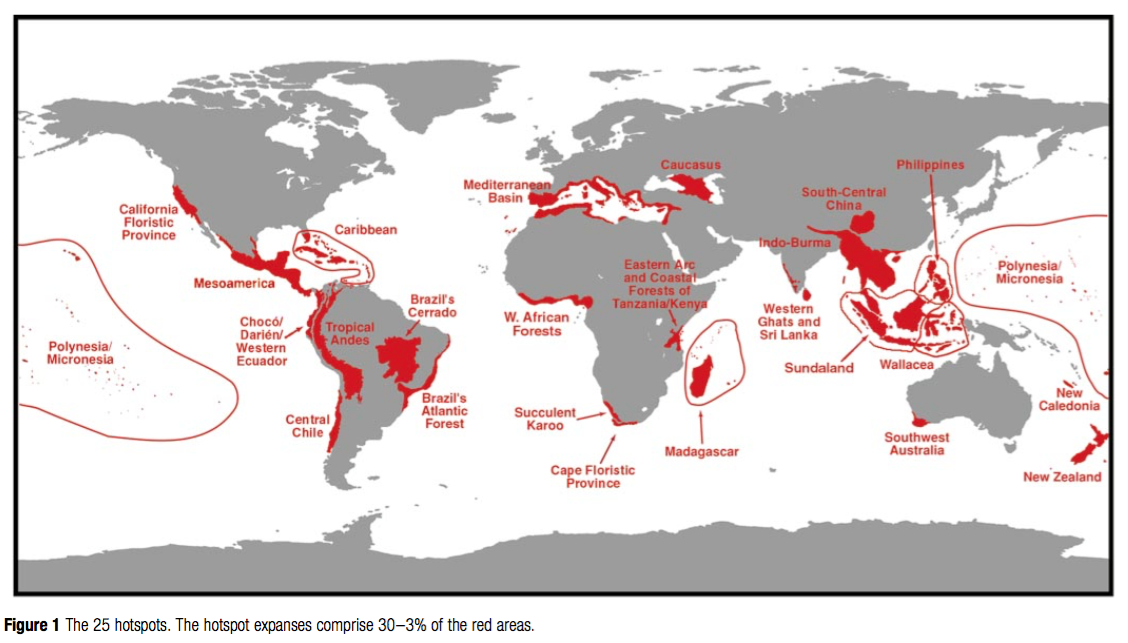 This figure taken from Meyers et al. (2000, p. 853) shows the location of biodiversity hotspots. Hotspots must contain at least 1,500 of the 300,000 plant species and the authors identified 25 hotspots in the world and remarked “sixteen hotspots are in the tropics, which largely means developing countries where threats are greatest and conservation resources are scarcest” (Meyers et. al, 2000, p. 854-55). This clearly demonstrates the important impacts of biodiversity loss on the developing world and shows the need for effective responses. However, biological conservation is not a viable option for many of these hotspots because the cost is high, at an average of $20 million per hotspot per year (Meyers et al., 2000, p. 858). Ecoagriculture offers an alternative as it integrates conservation and production in an effective way.
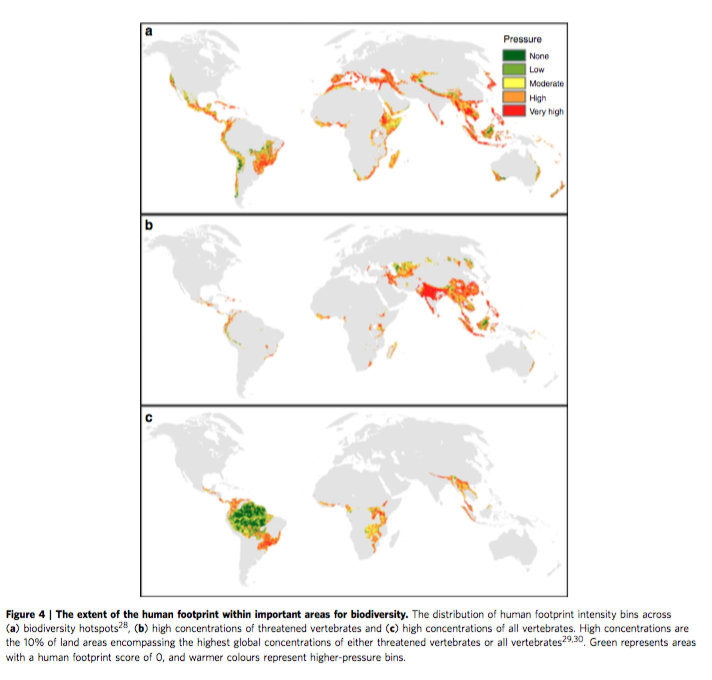
The extent to which these hotspots are affected by the human footprint is well-illustrated in another study by Venter et al. (2016, p. 6). This
study shows that 71% of regions had a 20% increase of human pressures (Venter et al, 2016, p. 3). The importance here is to demonstrate that the state of biodiversity differs depending on where it is measured, but overall the status is one of loss (UNEP, 2012, p, 134). According to Venter et al, “the temperate broadleaf forests of Western Europe, eastern United States and China, and the tropical dry forests of India and parts of Brazil, and parts of Southeast Asia’s tropical moist forest” (2016, p. 2) as the areas that will feel the pressures most. However, as stated previously, biodiversity and the rates of loss is not distributed evenly and this will be addressed in relation to the impacts of biodiversity loss and where they are felt.
The graphic demonstrates the need for alternative responses. Taken from the GEO5, it shows that although responses have increased they have no yet been effective in slowing biodiversity loss. Reponses to global biodiversity loss have tended to lean towards conservation. While this is the most successful scientific response, it is not the most efficient because countries are reluctant to set aside land for solely preventative purposes. (Brussaard et al., 2010, p. 35). Furthermore, these parcel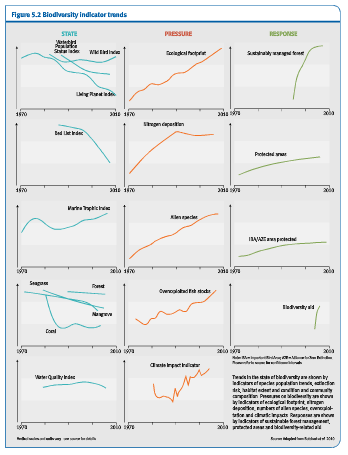 s of land are not being created at a fast enough rate to curb biodiversity loss (UNEP, 2012, p. 135). This demonstrates the demand for another effective response and because agriculture is the primary global driver of habitat loss and consequently biodiversity loss, sustainable agriculture is being closely examined as an effective response. This option is the most efficient because it protects other land from being developed, it decreases the use of chemical pesticides, and increases yield of ecosystem services. Ecoagriculture mixes natural and/or native landscapes and areas of agricultural production. Natural and/or native landscapes are defined as areas with high habitat quality and niches to ensure the survival of critical habitats and ecosystem services (Scherr & McNeely, 2007, p. 480). This technique integrates production and conservation as a response to the global terrestrial biodiversity loss and this is key to responding to biodiversity loss, while continuing to accommodate a growing population (Scherr & McNeely, 2007, p. 485). Agricultural improvement needs to focus on diversification and mixed land uses to accommodate the tradeoffs between agriculture and biodiversity (Brussaard et al., 2010, p. 35).
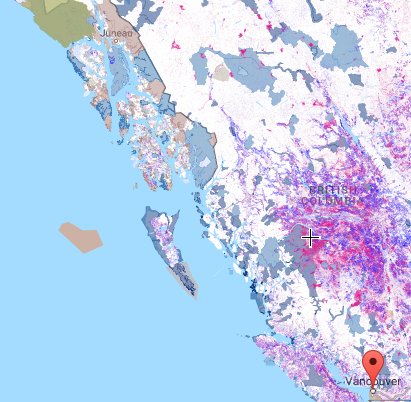
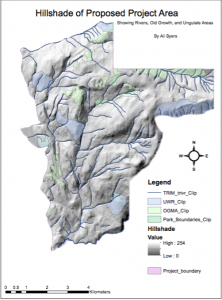
The final image is not taken from a site I used in my research paper, however is an easy-to-use introduction to terrestrial biodiversity and its many components. This site is effective because it allows the user to include as many or as few variable as they life. Below is a screenshot taken showing forest growth and loss, national parks, and hotspots in British Colombia. I think it is an important visual tool that encompasses enough information to make it a useful illustration of biodiversity status today.
References:
Brussaard, L., Caron, P., Campbell, B., Lipper, L., Mainka, S., Rabbinge, R., … Pulleman, M. (2010). Reconciling biodiversity, conservation and food security: scientific challenges for a new agriculture. Current Opinion in Environmental Sustainability, 2, 34-42. doi 10.1016/j.cosust.2010.03.007
Myers, N., Mittermeier, R. A., Mittermeier, C. G. da Fonseca, G. A. B., & Kent, J. (2000). Biodiversity hotspots for conservation priorities. Nature, 403, 853-859.
Scherr, S. J., & McNeely, J. A. (2007) Biodiversity conservation and agricultural sustainability: towards a new paradigm of ‘ecoagriculture’ landscapes. Philosophical Transactions of The Royal Society, 363, 477-494. doi: 10.1098/rstb.2007.2165
United Nations Environment Programme. (2012) GEO 5: Global Environmental Outlook 5. p. 133-167.
Venter, O., Sanderson, E. W., Magrach, A., Allan, J. R., Beher, J., Jones, K. R., … Waston, J. E. M. (2016). Sixteen years of change in the global terrestrial human footprint and implications for biodiversity conservation. Nature Communications, 7,1-11. doi: 10.1038/ncomms12558