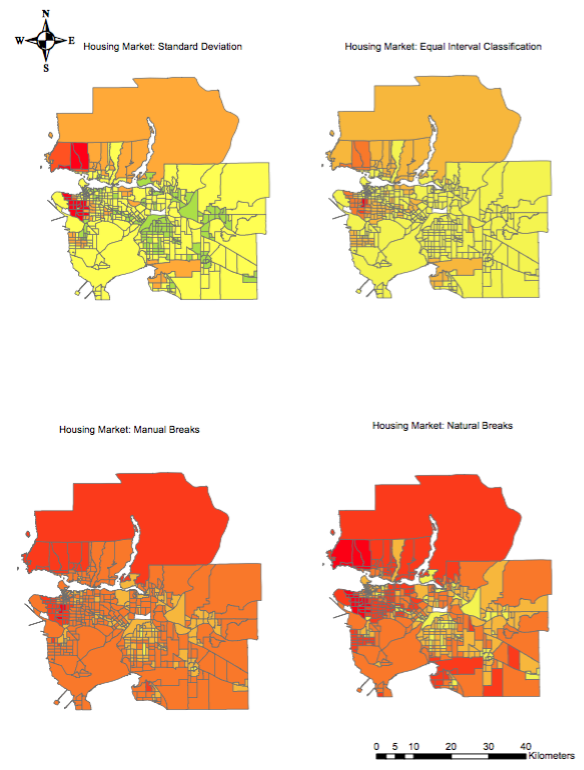
Each quantification method highlights a different aspect of the data. The manual breaks show how skewed the market in Vancouver is and highlights the high costs of housing. On the other hand, the equal interval map makes it seem like housing in Vancouver is reasonable and equally distributed. Standard deviation shows a relatively evenly distributed housing market, whereas natural breaks method shows the relative cost of the housing market and demonstrates how expensive the entire city is. Each method pushes the data towards a certain conclusion and therefore shows how data can be manipulated and used to create knowledge.