Over the weekend, I was lucky enough to venture outside of Vancouver for the first time since arriving in the Northern Hemisphere. My darling best friend was visiting from Chicago (where she has recently relocated with her husband) and we went on a few adventures! Whilst feeling blessed that the Vancouver sun was shining, we discovered Squamish, rode horses by rivers and through forests, biked around Stanley Park, enjoyed great coffee, aquarium-visited, Wreck-beached and ate a ton of sushi. It made for a memorable and breathtaking weekend and I definitely fell in love with BC a little bit more!
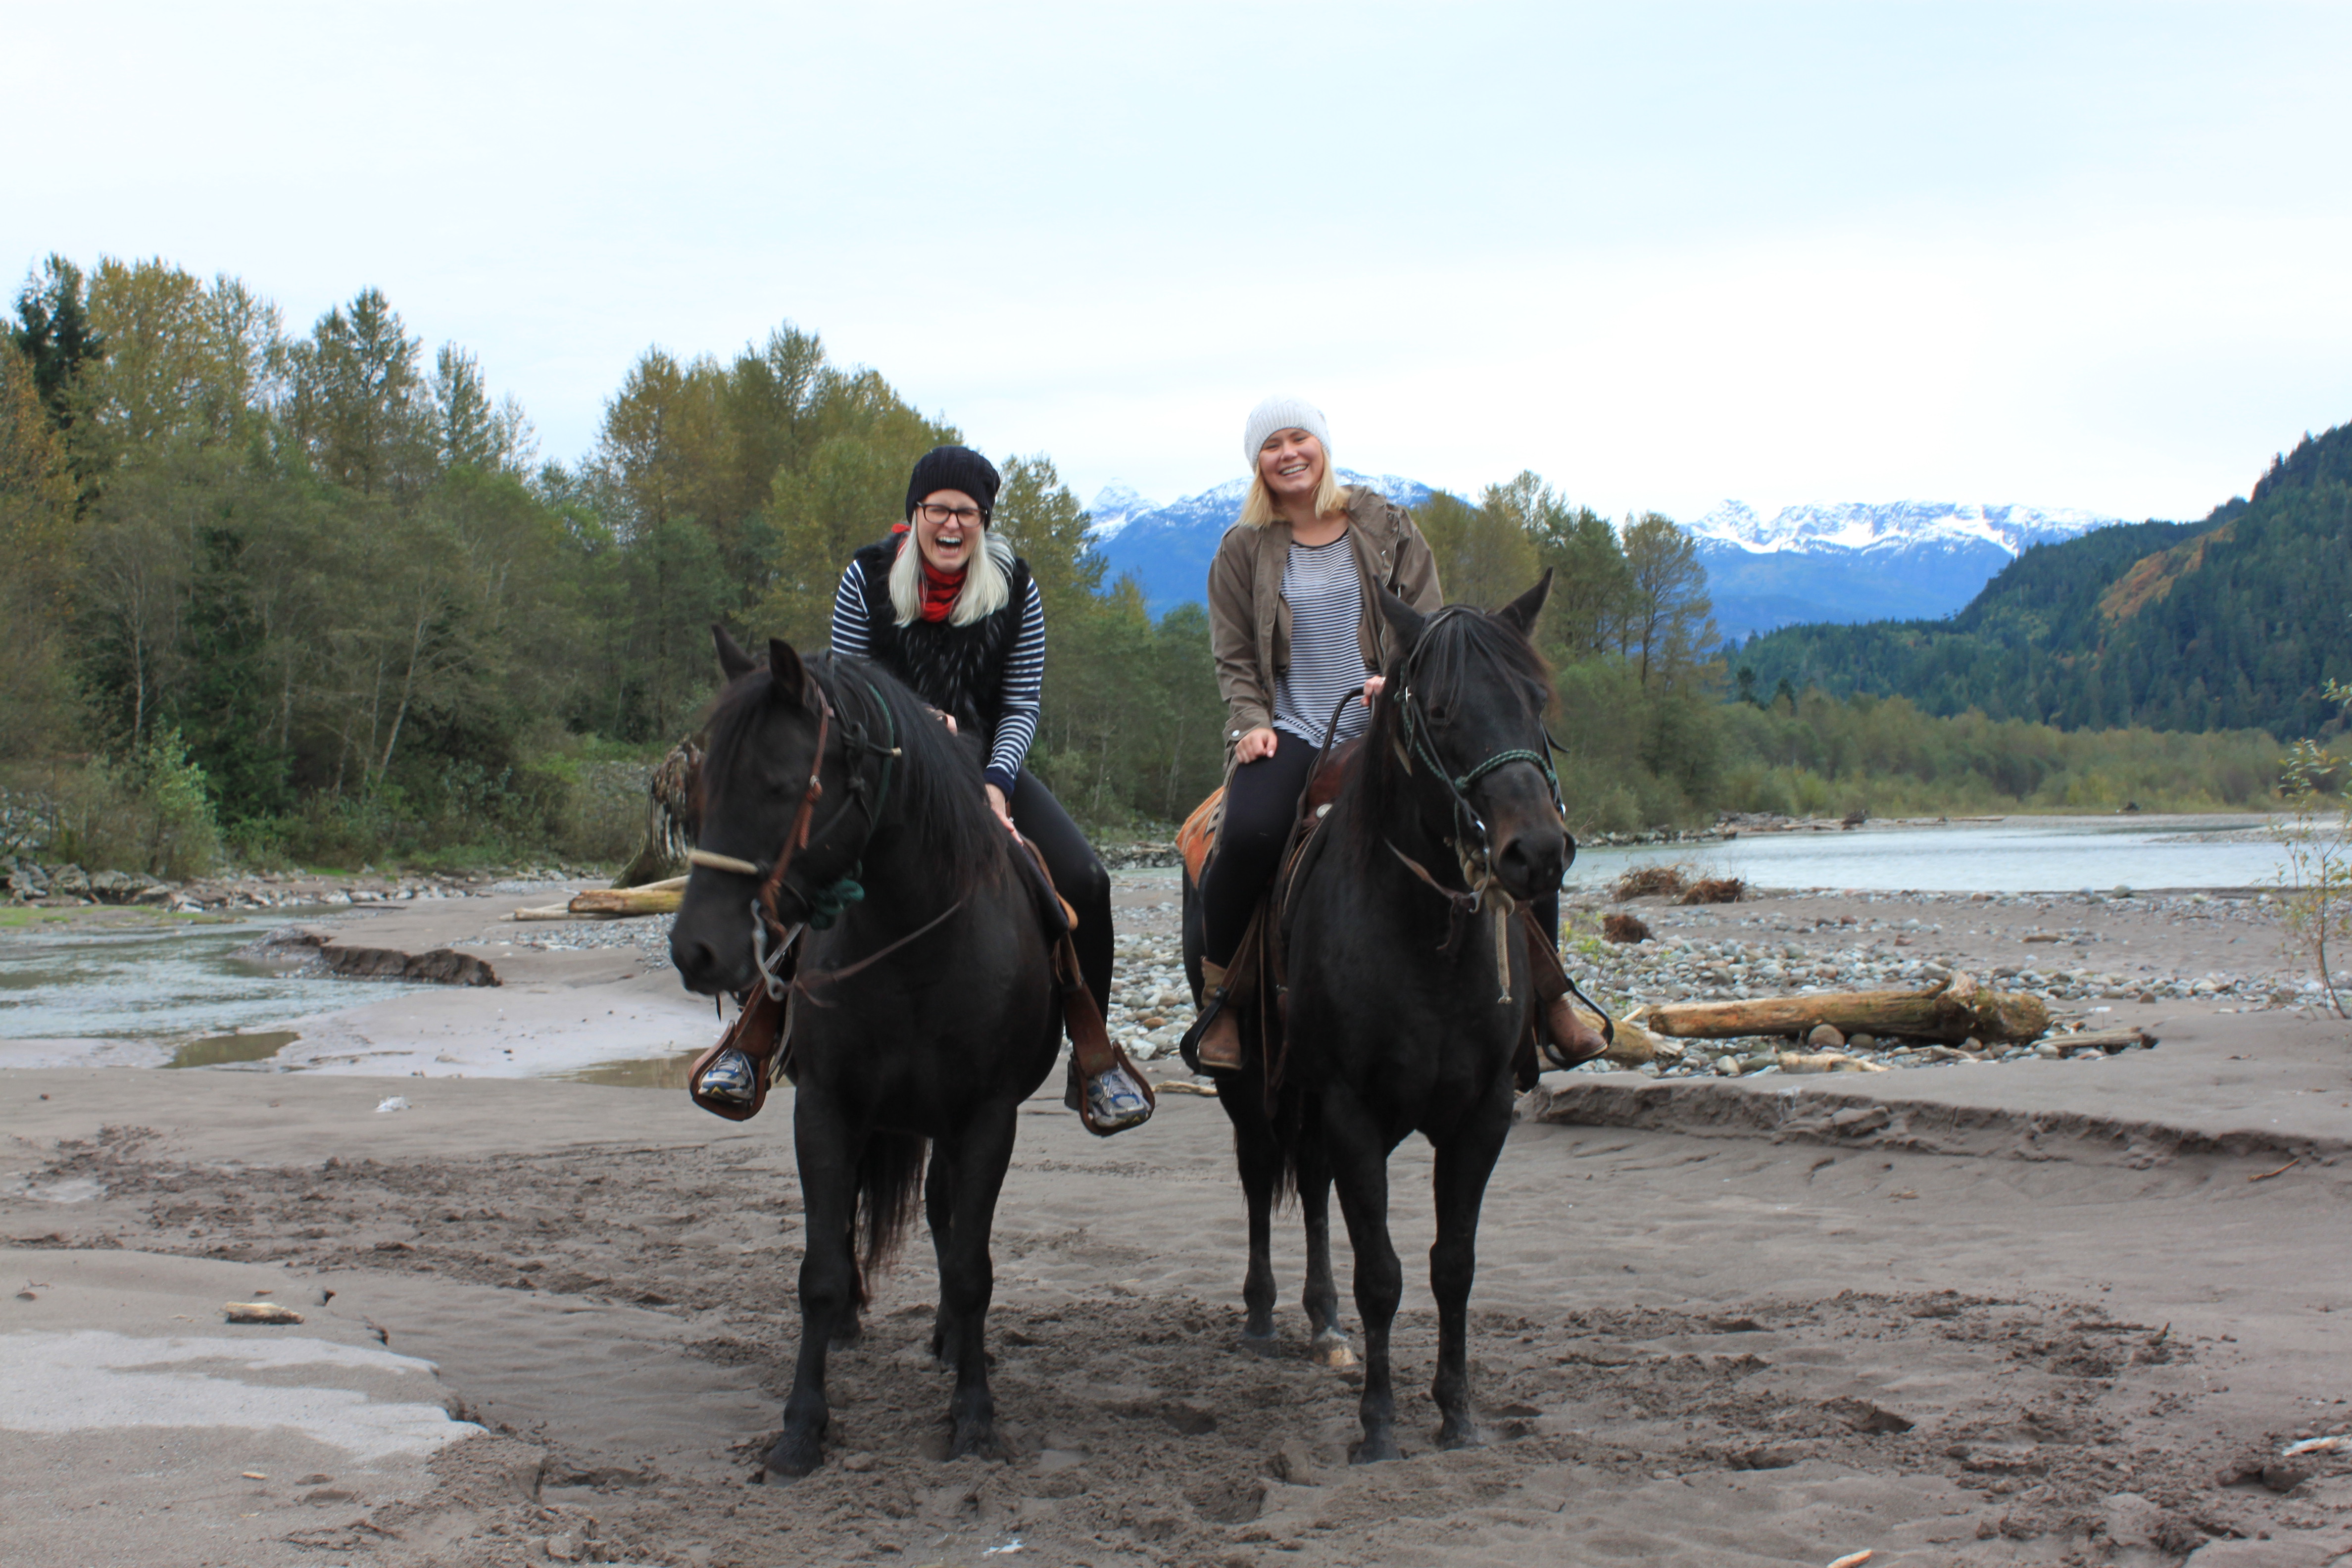 Riding in Squamish
 Alice Lake, a Beluga whale and a parrot (breed unknown!)
After taking my mini-break, I felt overwhelmed with the amount to achieve this week. However, I hoped to attempt to implement some of the technical analysis that was shared with us in our trading lab (plus a few other ‘shapes’ I discovered on my own).
—————————————–
To this point, I had primarily based my trading strategy on external information and broader market movements. My aim was to focus upon Live Cattle futures (which I dove into last week for the first time), try and see some trends or signs in the closest futures contract (Oct 2013), and attempt to make some quick profits! It was a little quick and dirty due to time constraints, but hoping the some of the analysis is technically correct!!
 This guy’s strategy is a little more fine-tuned than mine!
—————————————–
The graph below shows the daily movement for the October Live Cattle Futures contracts since July. I found three trends to focus my trading decision on this week: the rising wedge, the cup and handle and the ascending triangle.

——————————-
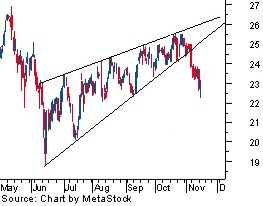
#1 The Rising Wedge
One ‘shape’ I discovered was the rising wedge from the middle of September to the beginning of October. As seen above, the trendlines are both slanted in an upwards direction and are converging. This wedge is seen to have a bearish pattern and signals that the future is possibly going to head downwards. Research has told me that as the price moves towards the apex of the pattern, the momentum is weakening and a move below the lower trendline is often viewed as a reversal in the upward trend. At the end of September, this happened, with the contract price dropping. Another example of this pattern is seen below.
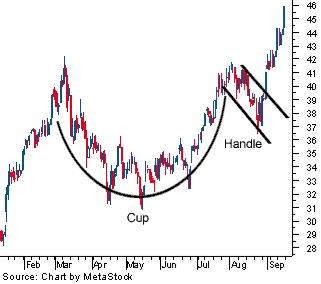
#2 The Cup and Handle
The second shape was a little more adventurous and had several components to it that needed to seen in a particular order on order evaluate what the potential signal may be.
Firstly, there should be an upward trend before the formation of the cup. Check. The cup should be nicely rounded, similar to a semi-circle. Mmm, kinda (the reason for this roundedness is that it is a signal of consolidation within a trend – weaker investors start to leave the market and new buyers and more resolute investors stay with the futures contract).
The height of the cup is also important. A traditional pattern should be between 1/3 – 2/3 the size of the previous upward movement. Yep, I can see that has happened in the case of the Oct contract. The height of the cup can also be used as an initial price target when the patten completes by breaking the handle. Lastly, the handle. It completes the pattern and refers to the downward move after the upwards trend on the right side of the cup. The general rule is that the handle retrace’s approximately 1/3 of the gain made in the cup. Most of these signs seemed to have held in the case of the Oct futures contract.
#3 The Ascending Triangle
Although the first two patterns were interesting to discover, I was looking for something to base this week’s trade on. I found it in the ascending triangle that looked to have developed from the beginning of October. Although, it was not as strong a pattern as the one below, I was going to run with it!

This bullish chart pattern is generally considered to be one that is to continue upwards. It is found within a period of consolidation of an upward trend and once the straight trendline meets the upward one, traders generally enter into long positions. The most common price target to aim for is set equal to the entry price plus the vertical height of the triangle. I decided to buy 6 long contracts on Tuesday morning, hoping for a rise the size of my triangle height!
—————————————–
So far, my ‘analysis’ has paid off and my Oct Live Cattle contracts are up 0.64%. In other news, I shorted 8 Nov Soybeans contracts on the same day (Tuesday morning). Soybean prices had risen on Monday, but I believed this increase would reverse as I predicted solid news to come in about the harvest underway. At the end of the trading week, Nov futures had cemented below its 100-day moving average at $12.865. I was now a richer woman, having made over $14,000 on these contracts!
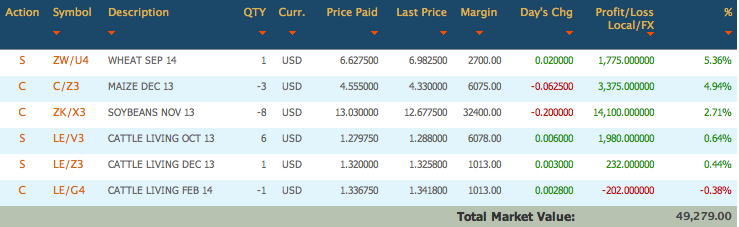 My portfolio summary as at the 11th of October
—————————————–
In the vein of my blog title, I wanted to end by sharing a little story I heard at the Vancouver aquarium last weekend that was perhaps the most sweet I have ever heard.
Otters hold hands whilst sleeping to stop them drifting apart whilst in slumber. I have known this fact for a while and definitely didn’t need anymore convincing that they were amongst my most favourite of animals. But they were about to get a whole lot cuter!
The trainer at the aquarium told us that a mother otter always keeps her baby on her belly to keep it safe. Before falling asleep she would get some seaweed (kelp) and tie it around herself and then around the baby to create a ‘seaweed seatbelt’ so her baby would never fall off while she rested! I think this is the most adorable story and just had to share that!!!
—————————————–
Happy Thanksgiving everyone!
The following sites helped me perform the analysis above: