
This week I decided to try a new strategy. I decided that instead of waking up early to trade I would stay up late. It worked great! Right when the markets open there are always interesting movements as new information built up expectations during the closing hours. Using this strategy I can trade with stop/limit as the market opens and then go to bed. When I wake up I just readjust and get ready for the market close.
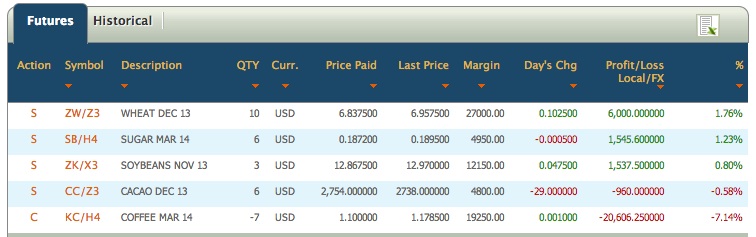
I have diversified my portfolio and its been paying off. Now my coffee losses are not as bad and I’ve been making some money on fast daily trades. Going long on wheat gave me good gains this week. It could have given me more but I decided to sell and make some gains instead of taking the risking the gain.
I’ve been slowly getting into technical analysis. I have been trying to apply forecasting techniques learned on FRE 585 to aid on my decision making. This week I started analyzing moving averages. I pulled out MA for 20, 50 and 100 days for wheat because this commodity has been having constant, well-defined ups and downs that if understood can help us generate some profits
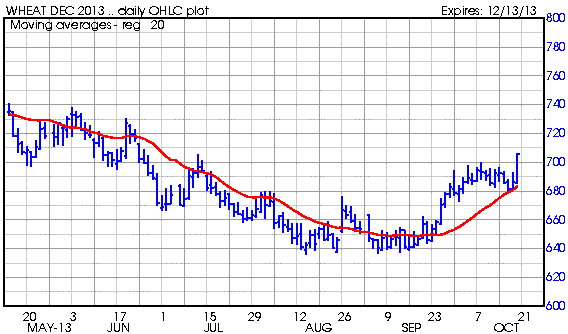

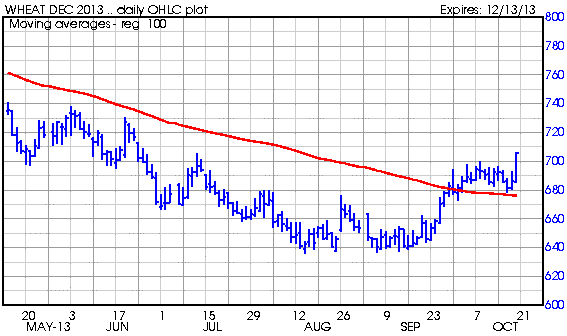 I remember that moving averages a do not have forecasting capabilities but are more than anything follow what happens. Despite this traders use them a lot to identify the underlying trend and as an aid to decide at what point to enter or exit the market.
Digging into moving averages I found that comparing MA’s with different periods can give us a lot of information about the momentum of our trend. They idea is to compare the convergence and divergence of the two moving averages. This indicator is called MACD and oscillates above and below the centerline. Positive values increase as the shorter MA diverges from the longer MA and means upside momentum is increasing. Negative values increase as the shorter MA diverges below the longer MA and means downside momentum is increasing.
It interesting to compare this charts to the MA. It definitely shows the high upward momentum of wheat has as of today!


By the way momentum measures the rate of change of price and how fast and strong this changes are. I will start using this indicators for my futures trades.
You can find much more about MACD here. http://stockcharts.com/help/doku.php?id=chart_school:technical_indicators:moving_average_conve
By the way I’ve been using stockcharts.com a lot and it is awesome. Recommended!
Cheers!