Uncategorized

Individual Report – Project Retrospective

For our project our group was thorough in considering usability as a process and an outcome. We were careful in evaluating our choice of tools based upon how likely those tools would let us build what we envisioned. Before selecting our final set of tools (Javascript, HTML, and CSS with GatsbyJS as the host and infrastructure) we took a look at more drag-and-drop style tools including Google sites and WordPress. Ultimately, we decided that even though our chosen infrastructure was more challenging, and could not be as easily divided between the team members, it best fit what we intended.

We played to our individual strengths and shared knowledge through regular group meetings – in these meetings we would share findings, what we learned, and did the occasional “tutorial” so that even if the technical aspects were largely done by myself, we all had a clear picture of the group’s progress. One of the reasons that we chose to include a thorough project summary was to highlight each member’s main contributions. My main contribution was to actually build the tool, but I was only able to do so in iteration and with feedback / testing from my group members.

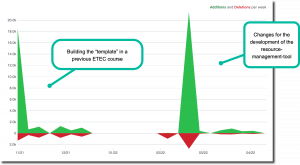
You can see the code here: https://github.com/alisonmyers/resource-management-tool. Because we used GitHub for our repository, I was happy to see the insights of Code changes over time:

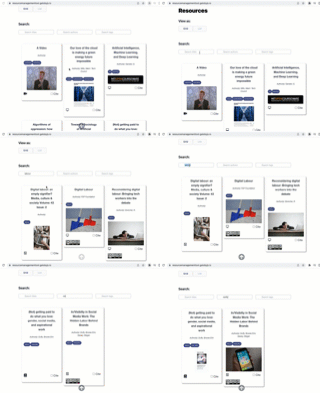
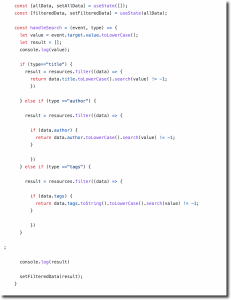
Personally, I wrote more dynamic functions that allowed the ingestion of data from multiple sources (Google Sheets being an attempted new addition), and allowed different kinds of information to appear in each resource card. This was only my second JavaScript project, and I was able to learn a lot by revisiting my old code! The trickiest bit of programming was making the search functionality work – and I am glad I persevered on this. If I were to do one thing differently, it would be to start earlier on the parts of code that were new to me – so that the presentation to the class would have been more complete.

See how the search functions (left) and the code written (right).

Our team was able to assess and demonstrate usability of our tool because we ensured that our decisions were grounded in literature, and were relevant to our original proposal and the initial reasons we decided that LOCR needed a facelift.

Standard
Uncategorized

Digital Labour

Welcome to a day in the life of Patty P. (Note – the video has chapter timestamps to pause and move through as needed if too fast or too slow).

A day in the life of Patty P.

References

Crawford, K. (2021). Atlas of AI. Yale University Press.

Duffy, B. E. (2017). (Not) Getting Paid to Do What You Love: Gender, Social Media, and Aspirational Work. Yale University Press . http://www.jstor.org/stable/j.ctt1q31skt

Duffy B.E. & Sawey S. (2022). In/Visibility in Social Media Work: The Hidden Labor Behind the Brands. Media and Communication, Cogitatio Press, vol. 10(1), pages 77-87. https://ideas.repec.org/a/cog/meanco/v10y2022i1p77-87.html

Standard
Uncategorized

Have Your Cake and Page Rank it Too

Dear Reader, this piece has intentionally been written in the style of a blog post, but don’t worry I don’t have any affiliate links.

That Chocolate Cake“That Chocolate Cake” by SliceOfChic is licensed under CC BY-NC-ND 2.0

PageRank, Algorithms, and Corporations (oh my)

PageRank makes finding a popular cake recipe website really easy, but getting to that cake recipe really frustrating. You have to read through someone and their dog’s entire life history, numerous links to other recipes, all as a way to maintain engagement and show you as many ads as possible.

Let’s try to get to that cake recipe …

My Google Search for a cake recipe, followed by one minute of scrolling to get to a recipe, sped up to 10 seconds. This video emphasizes the scale, volume and specificity of advertisements shown to me by Google's algorithm.

Now, this seems to fall into the category of and annoying but innocuous part of daily life. Maybe the blogger is making some amount of revenue (probably not) for their digital labour and placement of those ads (via Google AdSense) and your engagement with them. More likely, however, Google is profiting off of the work and associated advertisements. Profiting financially, but also in the collection of your data, which is now seen as a commodity or source of capital (Crawford, 2021).

Page What? 

But, why is this happening? PageRank (and other algorithms involved in Search Engine Optimization, SEO) and content prioritization. The higher the scoring the page you’ve come from, the higher score you get. If I’m an advertiser, I want the most traffic to my site, and I want to be improving my PageRank as I do it. So, I want my ads to be placed in as many high traffic websites as possible, because I also want to be able to share in the PageRank of those sites. This will increase my websites score, and hopefully push it further to the top of a search result. There is probably not a young marketing guru sitting and deciding which websites I should work with to make careful and thoughtful placements of those ads – it is more likely an algorithm. The more resources we interact with on the internet, the more likely we are going to be shown related ads, and often those ads have been promoted or placed by some algorithm. After all, algorithms are fast and cheap (Neyland, 2019). Advertisement and its proliferation is an important part of PageRank and content prioritization, as Noble (2018) states, “Google is an advertising company” (p. 5).

My search for cake didn’t directly bring me to an advertisement, although in some cases affiliate companies will be the “top search result”. Google Search might indicate ads in the search results, it will still “want” to show you pages that don’t seem like ads that you are likely to interact with that will ultimately benefit Google.

The public generally trusts information found in search engines. Yet much of the content surfaced in a web search in a commercial search engine is linked to paid advertising, which in part helps drive it to the top of the page rank, and searchers are not typically clear about the distinctions between “real” information and advertising. (Noble, 2018, p. 38)

A ConsumerWatchdog report showed evidence of Google prioritizing its own subsidiaries  partners over competition (Noble, 2018, p. 56). So, PageRank brings me to my cake which may also have affiliations with Google partners, all of whom are waiting for my clicks, and now the invention of PageRank interrupts me all the way to my recipe.

Slavin (2011) introduces the “big red STOP button” as the only form of human interaction in some systems that are algorithmically controlled. He provides examples of elevators designed to group you to your destination, and financial algorithms that exist in a black box, unguided, unsupervised and that will run until the big red button is pushed. However, the button is only included in systems that are deemed to need a failsafe – but who decides on the inclusion of that failsafe? Why would I need a failsafe on my journey to cake?

The risk comes when we forget that Google is a multi-billion dollar company that just so happens to be seen as a reliable source for information, and whose prominence as a “portal to the Internet” (Noble, 2018, p. 153) overshadows other public access points (which cannot afford to compete – after all, they aren’t making any money from my desire for cake). Google’s algorithms are tuned to bring you to advertisements. Google Search uses information about you, your previous interactions, its advertising partners and their information – and in combination with this data from every other user decides which content to show you and in what order. Part of that order may be useful, like the relevance of your search key words (based on how many other people searched cake and ended up clicking the link). However, there is still bias and systemic issues in the algorithms that prioritize content. For example, marginalized and oppressed groups may have some “keywords” negatively associated with them that come from public (as opposed to digital) racism which has been incorporated into a black-box algorithm. Noble (2018) gives the example of her search term “black girls” and how she was immediately shown websites containing porn or racist content.

We must ask ourselves how the things we want to share are found and how the things we find have appeared (Noble, 2018, p. 155)

I Google every day – in a mix of personal, academic, and professional settings that all ultimately influence each other, and me. My life in all of these areas are affected by the information I interact with. It creates a web of information that the algorithm uses to “decide” what else to show me – and does so in a way that seems reliable if not carefully interrogated. The advertisements shown to me in my “journey for cake” are clearly attuned to this – Google sees me as a tech savvy (ad: Dell), mattress needing (ad: Endy), individual, who hasn’t done her taxes (ad: Blackbaud).

What now?

Ultimately, having an understanding of algorithms and recognizing that they are not objective or neutral, but actually shape the world we are in is an important step in interacting with Google and its information. I can use the privilege of having institutional access to various databases to avoid PageRank in some instances. Alternatively, I could influence PageRank by rallying my mass of social media followers (hi, Mom) to search a particular phrase and then always select the same result  popular instances of Google Bombing (see “Idiot” https://fortune.com/2018/07/19/donald-trump-idiot-google-bombing/). But first, I’ll have to post my own cake recipe and get it to the top of a Google Search…

References

Crawford. (2021). Atlas of AI Yale University Press.

Meyer D. (July 19, 2018) Reddit users are manipulating Google images to associate ‘idiot’ with Donald Trump. Fortune. https://fortune.com/2018/07/19/donald-trump-idiot-google-bombing/ 

Neyland, D., Springer Social Sciences eBooks 2019 English/International, DOAB: Directory of Open Access Books, SpringerLink (Online service), & SpringerLink Fully Open Access Books. (2019;2018). The everyday life of an algorithm (1st 2019. ed.). Springer International Publishing. https://doi.org/10.1007/978-3-030-00578-8

Noble, S. U. (2018). Algorithms of Oppression : How Search Engines Reinforce Racism. New York University Press.

Slavin, K. (2011). How algorithms shape our world [Video]. TEDGlobal. https://www.ted.com/talks/kevin_slavin_how_algorithms_shape_our_world?language=en#t-896320

Varagouli, E. (Dec 23, 2020). Everything you need to know about Google PageRank (and why it still matters). Semrush Blog. Retrieved from: https://www.semrush.com/blog/pagerank/
Standard
Uncategorized

My Patterns of Attention

Data Collection

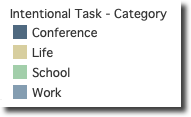
Legend – categories of intentional task (where I intended to focus my attention).

The day in my life that I chose was one where I knew I had specific tasks to focus on, but where I also know I was likely to be distracted. I chose the second day of a virtual conference that I was attending. This conference mostly involved video presentations, included one social virtual activity and was being held live, with recorded content also available. This conference took place on a day that I also had some work to do, and had a group project meeting (school). I chose a day that was heavily virtual – school, work, and the conference are all activities that I participate in virtually. I did so because throughout Covid I noticed a growing awareness of the inability to focus after hours on the computer, and I wanted to see how this would show in the data, especially when attending a heavily engaging event like a conference. The unique part of this conference is that all of the seminars are recorded and made available very quickly. After day 1 of the conference, I knew I would need more breaks, and so I was deliberate in parts of the conference to listen to the recordings while purposefully multitasking (I also had many chores to do that day!).

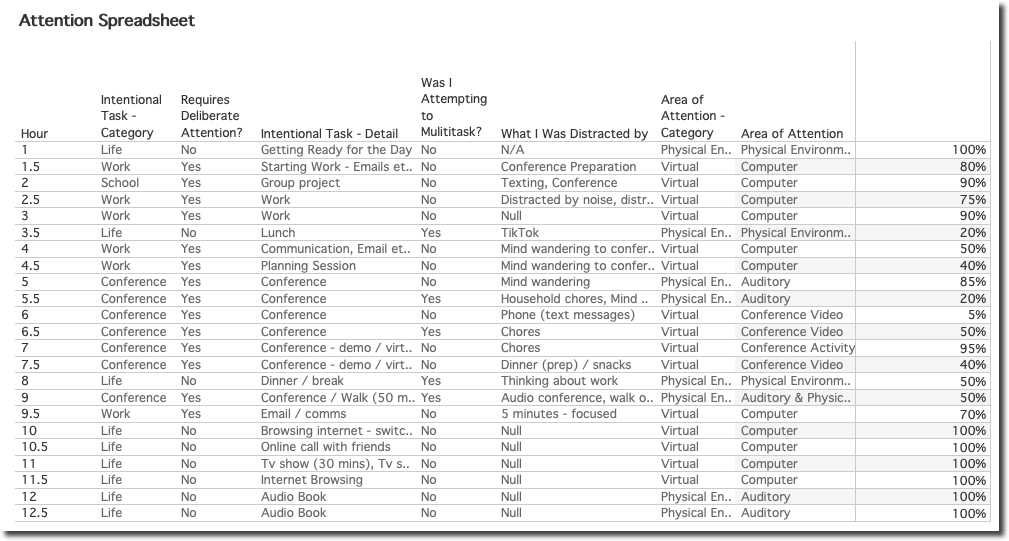
I began by creating a spreadsheet to help me track where my attention was. I divided the day into 30 minute segments and took notes about what I wanted to focus on (“intentional focus”), what I was actually focused on, and the % of attention I think I was paying to the intentional focus activity. I also categorized whether the intentional task requires deliberate attention, whether I was attempting to multitask, and the “area of attention”.

Enlarge

attention_2
My data collection (cleaned up version).

Data Analysis

I developed a dashboard to help me explore my day and investigate any patterns in my activity. I used the exploration and building of the dashboard to find the insights discussed further in this blog post. Here is a quick walkthrough (the dashboard and video are meant to be self contained, so may repeat some components discussed here.) The walkthrough shows the full-scale version of the dashboard which can be found here: Attention Dashboard

A quick description of the dashboard and interaction features.
A short video walkthrough of the project and dashboard.

A smaller version (that “fits” in WordPress) can be interacted with here:

Key Findings

Device Overload & A Few Stats

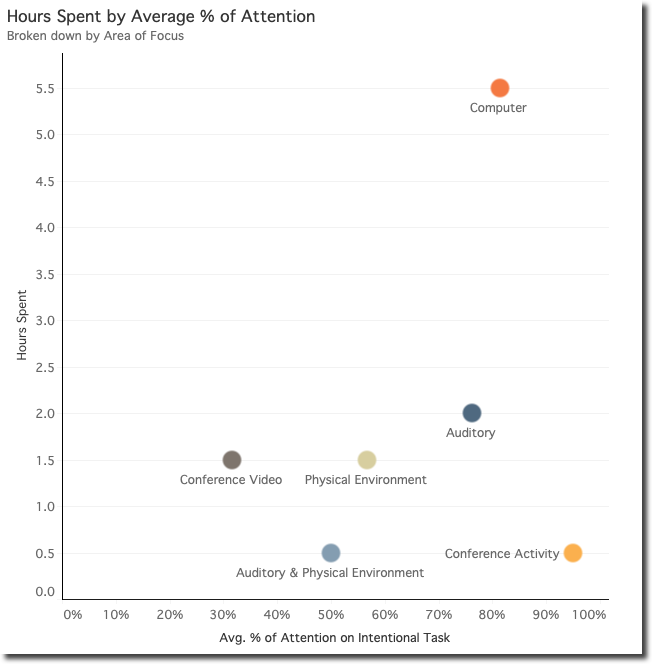
I spent my day interacting with screens! Of the 13 hours of recording, I spent only 4 hours not looking at a device. However, even in those 4 hours I was listening to either a conference recording or an audio book.

Using categories of “Virtual” and “Physical Environment” (to be anything not-device related) I spent just over 65% of my day paying attention to virtual devices. I purposefully multitasked for about 22% of the day, and attempted to focus on tasks that require deliberate attention for just about 61% of the day.

Multitasking

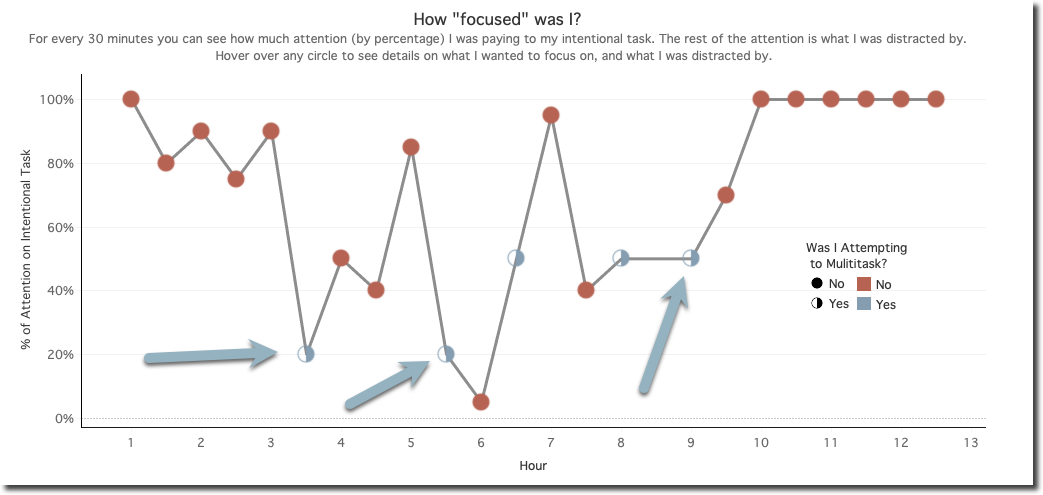
One pattern that I find interesting is when I look at the data based upon whether or not I was attempting to multitask. In these scenarios the “distraction” is really a secondary intentional task. My first instinct was that these deliberate multitasking sessions were followed by improved focused attention – however, this may be a misleading interpretation. The multitasking sessions involved lower focused attention because I was being deliberate. So, the upswings of attention after a multitasking event may just be a data collection issue. Reconsidering the data then, perhaps I was having difficulty with focused attention which was why I had so many multitasking events in the middle of my day.

Enlarge

attention_4-1
Attention by hour, coded as whether or not I was attempting to multitask. Notice the arrows identifying deliberate multitasking followed by peaks of focus.

When I look further into the data, I can see that I only really attempted to multitask during life and conference events. And that conference event multitasking brought my attention to 40%.

Concluding Thoughts

De Castell and Jenson (2004) point to examples of asymmetrical attentional relations, where attention can be paid unidirectionally rather than reciprocally in an argument against Goldhaber’s propositional that attention must be “paid back”. While I spent some of my day being paid attention to (in a group meeting, and in an online chat with friends), the majority of my day was simply ingesting information. Even then my attention was often divided, either purposefully or not. My experience of multitasking is closer to the “youth” than the “elder”, I do multitask, however my thought process regarding attention is closer to traditional views of attentional economy.

The data I have shared and visualizations created are somewhat cleaned up versions of originally “messy” data collection. Upon reflection toward the data cleaning process, I recognize that I developed a data collection and categorization framework that seemingly put emotional value toward “paying attention”.  In the details about what I was distracted by I have a negative association when writing and reviewing: “mind wandering, got distracted by phone, thinking about other”. I felt bad that I was distracted when I was not intending to – when I was purposefully multitasking, less so.

De Castell and Jenson (2004) propose a new way to consider attention in an educational context with a need to “better identify and develop forms of productive engagement in which dynamic, multimodal learning environments are animated by students’ deliberate and sustained attention” (De Castell & Jenson, p. 18, 2004). If I reframe my day toward learning – I was engaging with various kinds of media (audio, video), communications (text, video conference), and I was making connections between conference materials and my day-to-day work. If I look at what I was distracted by (when it wasn’t TikTok), when I was working I was distracted by the conference, and vice-versa. These could be considered distractions, or they could be considered as opportunities for re-engaging with material in a new way, for contextualizing new information, or for being creative in my choices of digesting various forms of media. Indeed, what I was taking part in could be the organic convergence of media (Jenkens, 2001) – where the context can be considered an educational one. Reconceptualizing the digestion of media in this way makes it seem a standard of the 21st century consumption of information, rather than a negative action.

References

De Castell, S. and Jenson, J. (2004), Paying attention to attention: New economies for learning. Educational Theory, 54: 381-397. https://doi.org/10.1111/j.0013-2004.2004.00026.x

Jenkins, H. (2001). Convergence? I Diverge. I . MIT Technology Review.

Standard