The purpose of our project is to examine how climate change projections will affect ALR areas and therefore agriculture in the Okanagan region of British Columbia. To do this we looked firstly at the current soil capability in the ALR areas, which can then be used to identify limiting factors such as climate and topography with concerns to the lands agricultural uses. Secondly we looked at future climate projections for 2025 and 2055, particularly focussing on annual precipitation, growing degree days and frost free days. All of which are indicators of climate capability and used as indicators for types of crops to grow in a given area.
Research and Data
For the purposes of this project, a literature review of scientific papers, reports, census data and other agricultural research was carried out in order to look at current agricultural management methods used and how different scenarios in climate and soil capability may change this. Allowing us to provide recommendations for changes to agricultural management and what is needed for the region to be food secure in the future with climate change.
We were able to find one research paper with similar objectives which focussed on potential agricultural land in the Kootenay region of British Columbia (Roussin, 2014). From the results found in this paper, comparisons can be made with regards to future changes in crop types and management.
Soil Capability Map
The soil capability was mapped for the Okanagan region using data from the provincial agricultural land commission website and a coordinate system of NAD 1983 BC Environment Albers. Our literature review showed the classification of soils used in agriculture in British Columbia, separated into 7 classes based on a number of characteristics such as depth, slope, fertility and climate.
The soil capability shape file attribute table was exported as a .csv file into Excel for easier manipulation. The classification field of the attribute table had missing data points, which were replaced with zeros (0), so that it could be displayed with graduated colours.
The .csv table was imported back into ArcMap, and was joined with the soil capability shape file layer. The manipulated field was used to classify the 7 different soil capabilities with graduated colour representation.
The Okanagan region boundary was selected from a shape file of all regional boundaries in BC, with the soil capability and ALR regions clipped to the Okanagan boundary.
Due to difficulties with the data and the need to classify all the soil data, which was extremely time consuming, we were not able to produce a data flow diagram to show the methodology for the soil capability map.
ALR Boundary Map
To create the map showing the ALR regions in the Okanagan, a shape file for ALR boundaries was overlaid with a base map of British Columbia, using the coordinate system NAD 1983 BC Environment Albers. This was then clipped to the Okanagan region boundary taken from a shape file of all regional boundaries in BC.
Climate Data Manipulation
Climate projections for 2025 and 2055 were used, from Climate BC with a coordinate system of GCS WGS 1984, to see how annual precipitation, growing degree days above 5 degrees celsius and frost free days changes over time with the effects of climate change.
- Initial issues with Climate WNA Ascii files not properly transferring to Raster and then CSV files resulting in poor resolution.
- Led to the use of Climate BC data.
- Clipped raster climate files to Okanagan boundaries in Data Frame Properties
- Transformations of coordinate systems using Data Frame Properties for the overlaid lakes and ALR polygons
- Reclassified annual growing degree days and annual frost free days, 2055 Rasters into a range of suitable grape growing conditions found in literature review.
- Converted ALR Polygon to Raster
- Conducted Zonal Statistics using ALR Raster input with mean annual precipitation, annual growing degree days and annual frost free days, 2055 Rasters to get the output mean ALR in each.
Quantitative Analyses
The cumulative measure of annual growing degree days is calculated by:
GDD = (TMax + TMin)/2-TBase
Where TBase is the degrees that your growth is based on, in this case 5°C
This calculation is used each day and then summed monthly.
Equation for Estimation of Derived Growing Degree Days above 5°C:
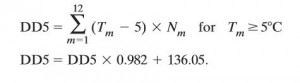
- Resolution of climate data was limited to 800mx800m, reducing the accuracy of our data for the region.
- Mixed pixel problem from using rasters for the climate data and analysis, resulting in reduced resolution through the shifting and clumping of x/y values.
- Individual climate change scenarios were used to project future changes, however there is always a certain amount of uncertainty associated with these predictions.
Firstly, there was soil data missing in the soil capability data set, reducing the accuracy of our results and making our maps less representative of the Okanagan region. The study concentrated in West Kootenay experienced this same problem, not much can be done to remedy this except leave it out of analysis (Roussin, 2014).
Secondly there were a number of problems with the soil capability and climate data sets which proved time consuming. The soil capability data had to be reclassified so that it could be mapped and displayed with a graduated colour map, however this resulted in a simplified version of the soil classification. Sub-classes, such as salinity, erosion, stoniness and moisture limitation, were not included in the map due to its complexity. In future project developments these sub-classes should be taken into account to get a better understanding of the area specific management requirements.
Thirdly, there are limitations with the scope of our project. Other climatic variables, such as precipitation variability and water supply, is not taken into account that needs to be for more accurate management recommendations. Other than climatic variables, there is limited data, other than the agricultural census, for current crop and land use in the Okanagan and what current ALR areas are used for. From our review of literature, there are currently studies being carried out for more specific detail on ALR land uses and current crops in the region.
Lastly, there is the limitations regarding our GIS skills which are currently still at the beginner stage. In the future, as our skills develop, further developments can be made to broaden and improve the analysis, to give more in-depth management strategies.