All posts by ashley-belle burns

49th Course Crosiere EDHEC

Myself and three others from the UBC Thunderbirds Sailing Sport Club travelled to Arzon, France, in the Port du Crouesty to compete amongst 180 different schools in the largest student offshore regatta in the world! Our team went to the regatta hoping for decent results but at the end of the week we were battling for first place in the J70 fleet! It was five days of intense racing within our fleet with all of the boats extremely close together. By the very end our team made really good calls on the wind and we came 1st in our fleet! We were so excited and even more when we received our trophy and medals!

Hopefully the team continues to go to that event and can have amazing results in some of the other classes of boats as well! We are so proud of ourselves and it was an amazing way to end my university sailing career!


270 – ArcGIS Accomplishments

As my Geographic Information Systems class comes to an end, I’d like to reflect on the things I’ve learned, particularly using ArcGIS.

First, I was able, by the end of the class, to independently find datasets online, download them, and then export them into ArcGIS and then manipulate them for my own maps. I have used a variety of different sources to find data including the Government of Canada’s website, BC’s data library and the UBC data library.

Second, I now feel comfortable with a variety of ArcToolbox tools. The one that I feel most comfortable with and am glad that I can use is the split tool, which allows you to trim layers based on the boundary of another layer. This is very convenient when comparing something with different datasets and you can trim the features you do not need anymore

Third, I am comfortable and knowledgeable in changing and using different classification methods to display data. I believe it is important to see how different classification methods will project your data, and all cartographers should be comfortable and skilled in choosing the “correct” one to be most accurate or truthful.


270 ArcGIS Lab 5

Final Analysis of Lab 5

Environmental Assessment – Garibaldi at Squamish Project 

Q: You are a natural resource planner who has been retained by the British Columbia Snowmobile Federation who was initially opposed to the proposed project. Your task is to examine the Environment Assessment’s recommendations and Whistler’s criticism to evaluate whether there is sufficient evidence to continue to oppose the project or whether concerns can be addressed as part of the project. Your requested to present your results in the form of a map and a series of answers. 

The project that has been proposed by Northland Properties and Aquilini Invest Group should not be approved based on it’s potential disruption of protected environments. The project, a large mountain resort within the Garibaldi Park boundaries, would not be a positive addition. Currently this park is used for recreational hiking and camping, with no road access and no facilities. The proposed project would bring a large amount of development to the area. This raises potential threat to all the protected area in the region. This included Old Growth Forests covering 6.78% of the area, ungulate winter range area of 7.9%, red listed species habitat of 24.8%, and fish bearing streams and riparian buffers of 16%. Within the proposed project boundaries, 25% of the area is sensitive habitat, including fish bearing streams, red-listed species habitats, old growth forests and ungulate winter range area. One quarter of the total area is not a small sum, and would cause significant stress on these environments in the construction phase, operation phase, and decommissioning stages.

In analyzing the data, I merged all of the red listed species together in to one layer so that they could be selected with ease. Furthermore, all of the streams that are likely to bear fish were selected and given buffer zones as riparian zones. Old growth forest data and ungulate winter range data were combined with the above layers by union so that these sensitive environments could be overlaid on the proposed project’s area within the park boundaries. In the maps attached, the majority of the sensitive area lies below the skiable terrain, however, this would be where the majority of the development would occur for shops, accommodations, restaurants etc. These areas would see the most development and the most destruction.

One of the largest concerns for this project is that red-listed species habitats cover just under a quarter of the projects area, 24.8%. Furthermore, these habitats are generally linked together, rather than pockets, and in developing this area the project would fragment these habitats from each other. Second, of the projects boundaries, 31.7% of the area may not even receive enough snow. This is concerning because the project risks so many habitats for something that is a growing uncertainty as climates continue to rise. The area already has a successful ski destination within an hour of the proposed project, and show not endanger ¼ of the area’s sensitive areas. Development in this sensitive area would speed up the detrimental effects of climate change to a rate that would not allow for species adaptation.

This area should not be approved for commercial development. It lies within a sensitive area and should be left to recreational exploration. Those who are compelled to see this environment can take the necessary steps to venture into the park boundaries.

Garibaldi at Squamish Development Site

Here, you can find a Close up of Project Development Site

Additionally, here is a projection of the Project Hillshade Map

Q: When working on environmental projects, you sometimes become involved in proposals you do not ethically believe in. Do you personally think the project should be allowed to continue? 

No, I do not think this project should go forward. There are already the coast mountains outside of Vancouver, as well as Whistler and I do not think an additional ski development would benefit anything. It would draw additional resources, cause more harm to the environment, and likely all other resorts in the area would suffer from it. Additionally, the space they would like to develop on is not private and people already has trail access onto it. Those who truly want to go and ski the area are able to with the proper training and equipment.


270 ArcGIS Lab 4

Lab 4 Final Analysis

Q: What is affordability measuring and why is it a better indicator of housing affordability than housing cost alone?

Housing affordability takes into account income as well as dwelling value. When choosing the data, we combined median value of dwelling and median family income. If you only choose housing costs, you have no idea how much money is spent relative to how much money someone earns. For example, minimum wages vary for different provinces or states, and that would not be reflected if you only selected housing cost.

Q: What are the housing affordability rating categories? Who determined then and are they to be trusted? 

The rating categories are part of the classification of data, and are controlled by the author of the map. The author can choose how many classes they wish to show, as well as which method of classification they wish to use. In playing around with changing these variable, you can get very different maps that show inherently different views of “affordability”. You can see this in Vancouver’s Mean Dwelling Classification Comparison. In choosing different means of classification, different views of affordability is created. In essence, all methods of classification are true, because they follow a mathematical method however, an author can strategically choose a certain method to artificially make more or less space look affordable. When reading a map you should always be critical and aware, not necessarily mistrusting.

Q: Is affordability a good indicator of a city’s liveability?

It can be however it leaves a lot of information out. For instance, how many people retired in or had to leave Vancouver in order to Vancouver? What are the demographics of the city and the labor breakdown? What is the average amount of work hours in a week? Additionally, how many people work in Vancouver but don’t live there or vice versa? When comparing income and dwelling value, it can give you a basic picture, but it does not include everything. Liveability should also include a certain degree of happiness or comfort.

Here you can find a map of Vancouver vs. Ottawa’s Affordability.


270 ArcGIS Lab 3

Lab 3 Final Analysis

In creating a Map of Vancouver’s Danger Zones for the areas  most susceptible to destruction of a tsunami, I evaluated the following;

Q: What percentage of the City of Vancouver’s total area is under danger?

By using the attribute table for the Vancouver Landuse layer, I found that the sum of the area that would be affected would be 131,020,600 m squared. This means that 15.5% of metro Vancouver’s land would be in danger form the effects of a tsunami.

Q: List the healthcare and educational facilities within the danger zones: 

Educational facilities: St. Anthony of Padua, Ecole Rose des Vents, Heritage 3R’s School, Vancouver Montessori School, False Creek Elementary, Emily Carr Institute of Art and Design, Henry Hudson Elementary, St John’s International, St Francis Xavier, Institute of Indigenous Government.

Health Care Facilities: False Creek Residence, Broadway Pentecostal Lodge, Coast West Community home, Yaletown House Society, Villa Cathay Care Home.

270 ArcGIS Lab 2

Lab 2 Final Analysis

Q: Describe how to fix misaligned and/or improperly referenced spatial data:

When data layers are projected with different coordinate systems it is impossible to make meaningful spatial analyses because certain properties will be distorted between layers. When projected anything from 3D to 2D, cartographers must choose the properties they wish to keep more accurate, and which they are not so worried about. This includes preserving distance, area, shape and direction. If layers are in different coordinate systems, objects will not line up and these different properties will be distorted in different ways for each layer. Furthermore, this will impede your ability to make calculations because they will not be accurate.

In order to fix this, we much transform the data layers to match the desired coordinate systems which reflects the properties you want to preserve. This involves going into the data layer’s properties and manually selecting the preferred coordinate system and creating a new version of the layer.

Q: Discuss the advantages to using remotely sensed Landsat Data for geographic analysis:


Landsat Data has been collected since 1972 when the program first began scanning the earth’s surface, which makes the use of this data geared very much towards comparisons. Additionally, Landsat Data uses the energy and radiation from the sun and the wavelengths to create  raster images. The satellites can scan the same space every 16 days, and makes for tracking changes very easy.  You can also select the bands (wavelengths) that you want to work with rather than everything. lab-2-part-4

211 Final Essay Research

Following the majority of my research I was able to create this DPSIR model for what I learned on Soil Degradation. Anthropogenic sources are a large contributor and the main driver towards soil degradation however, their are natural drivers such as wind and water erosion. Throughout my research, it became increasingly frustrating that soil degradation is largely ignored in climate simulations and sustainability conversations surround climate change.

dpsir

Below is a list of the resources I used in writing my essay.

  • Bouma, J., & Mcbratney, A. (2013, March 22). Framing Soils as an Actor When Dealing With Wicked Environmental Problems. Geoderma, 200-201, 130-139. doi:10.1016/j.geoderma.2013.02.011
  • Facts on Animal Farming and the Environment. (n.d.). Retrieved from http://www.onegreenplanet.org/animalsandnature/facts-on-animal-farming-and-the-environment/
  • Forge, F. (1998, August 27). Agriculture Soil Conservation in Canada (MR151e). Retrieved from http://publications.gc.ca/Collection-R/LoPBdP/MR/mr151-e.htm
  • Lal, R. (2002, November 29). Soil Erosion and the Global Carbon Budget. Environment International, 29(437), 450th ser., 437-450. doi:10.1016/s0160-4120(02)00192-7
  • Lal, R. (2015, May 13). Restoring Soil Quality to Mitigate Soil Degradation. Sustainability, 7(5), 5875-5895. doi:10.3390/su7055875
  • Mcneill, J. R., & Winiwarter, V. (2004, June 11). Breaking the Sod: Humankind, History, and Soil. Science Magazine, 304(5677), 1627-1629. doi:10.1126/science.1099893
  • Osman, K. T. (2014). Soil Degradation, Conservation and Remediation. Dordrecht: Springer.
  • Pimentel, D., Harvey, C., Resosudarmo, P., Sinclair, K., Kurz, D., Mcnair, M., . . . Blair, R. (1995, February 24). Environmental and Economic Costs of Soil Erosion and Conservation Benefits. Science, 267(5201), 1117-1123. doi:10.1126/science.267.5201.1117
  • Rajan, K., Natarajan, A., Anil Kumar, K., Badrinath, M., & Gowda, R. (2010, September 25). Organic Soil Carbon – The Most Reliable Indicator for Monitoring Land Degradation by Soil Erosion. Current Science, 99(6), 823-827. Retrieved from http://environmentportal.in/files/Soil organic carbon.pdf

GEOG 211 Final Essay – Soil Degradation

Soil Degradation; Overlooked, Oversimplified, and Overworked

In current discussions surrounding climate change and environmental crises, many issues are considered wicked problems. These problems are defined as wicked because there is no single, predictable solution and we must balance between the economic, environmental and social interests of multiple stakeholders (Bouma, 2013). One of the most often overlooked wicked problems of the 21st century is soil degradation even though it is vital to so many different earth systems and ecosystem functions. Soil degradation involves both the natural and anthropogenic pressures put on soils leading to physical, chemical, biological and ecological soil degradation. Soils are considered non-renewable resources, and can take thousands of years to build back up to fertile, productive states (Osman, 2014). Soil degradation is not overlooked due to a lack of data, on the contrary “many studies convincingly document the importance of soils when dealing with the global environmental sustainability issues of today…. [however,] recent strategic environmental reports hardly mention soils” (Bouma, 130). The current state of our soils, and in turn most of our livelihoods, depends on soil degradation becoming a global issue that is should be.

The degradation of the planet’s soils is far from recent due to anthropogenic and natural pressures that have been affecting the surface of the planet since its creation. Harsh winds, flash flooding, topology, glaciation, acidification, salinization are all examples of natural soil degradation. Humans have been using the land for centuries and have degraded soils through land-use mismanagement, compacting soils, nutrient depletion, disposal of waste, chemical contamination and irrigation methods (Forge, 1998). All these factors put pressure on, and effect the fertility, productivity, health, and quality of our soils (Osman, 2014).

The authors of Breaking the Sod argue that there have been three major waves of erosion from anthropogenic pressures in our relatively short history on earth. The first wave of erosion came with our first civilizations and their experiments with agriculture. A modest amount of erosion from these civilizations happened as they learned how to balance irrigation, nutrient replacement, and crop rotation. Some early civilizations were not successful in finding harmony with the land, and soil degradation led to famine or, in extreme cases, the collapse of civilizations. The second wave of significant anthropogenic erosion came as humans manufactured and used stronger and sharper agricultural tools. These instruments helped them to break up the soil and leave it more vulnerable to natural processes of erosion such as wind and water runoff. Later on this led to the compaction of soils through livestock and heavy machinery. The third wave of erosion comes with the rapid population growth, modern medicine to extend our lifespans, and our migration from farms to cities in the 20th century. Urban cities are directly responsible for “nutrients from fields [leaving] to cities” (McNeill, 1627) and disrupting the delicate balance. This results in more degradation as farmers have no choice but to use fertilizers to put nutrients back into the soils. The rate of erosion following these three waves has grown exponentially, and the “past 60 years have brought human-induced soil erosion and the destruction of soil ecosystems to unprecedented levels” (McNeill, 1628).

In the Canadian context, we are a nation that relies economically on resource exploitation, which has led to direct negative impacts on our soils. In the 1920’s Alberta alone saw 10 000 abandoned farms which was followed by prolonged drought and depression in the 30’s. This era was called the “Dust Bowl”, where our fertile soils turned to dust, which led to the Prairie Farm Rehabilitation administration. In the 1980s the prairies saw another period of drought which led to severe erosion and salinity of the landscape. In a 1983 report it was estimated that the cost to society from salinity was $257 million/year and the cost from wind and water erosion was $368 million/year. From this desperate situation a number of recommendations were made that included direct seeding, decreased tillage, planting foraging crops on marginal lands, wind breaks, grassed waterways, strip cropping and perennial barriers (Forge, 1998).

The quality of soil can be found using a variety of methods, and can differ depending on the type of soil you are trying to measure. However, the most reliable indicator is soil organic carbon. Soil organic carbon includes the living soil biota and the dead biotic material found in the soil, predominantly in the topsoil (Lal, 2015). Other methods include electrical conductivity, available soil water, micro-aggregates, and dehydrogenase activity, respectively (Rajan, 2010).

Data and the use of soil organic carbon is also an important factor in the global carbon budget, something that is largely disregarded. Lal argues that “carbon (C) dynamics and emission of carbon dioxide (CO2 ) and other other greenhouse gases (GHG’s) into the atmosphere have not been given the emphasis they deserve” (Lal, 438) in climate change discussions. In addition to an already wicked problem, “emission of CO2 and other GHGs by soil degradation is an important but neither an obvious nor an easily quantifiable source” (Lal, 340). Although it is hard to fit soil degradation into the budget, it cannot be disregarded as it currently has been. The terrestrial carbon pool, which includes the planet’s soil and vegetation, is the third largest pool in the carbon budget. Within this, the soil carbon pool, to one meter in depth, accounts for 2300 Pg alone, which is three times that of the atmospheric pool. Furthermore, is it estimated that soils release 4% of their carbon pools annually into the atmosphere, contributing to climate change, which is ten times that of fossil fuel combustion (Lal, 2002). Soil degradation needs to be included in climate discussions and projects to ensure that we are keeping track of all our carbon sources and sinks.

Although soil degradation can easily be described using the soil organic carbon, the data on soil degradation remains limited for several reasons. First, soil types differ substantially around the world, and it is hard to make meaningful comparisons. Second, natural and anthropogenic processes of erosion are not distributed equally, making it hard to compare across large areas. Third, there are many factors within the composition of soil that are either underestimated or overestimated, leading to different outcomes and predictions. This is most apparent in the estimates of historic loss in the soil organic carbon due to land use change, where “the global loss has been estimated at 40Pg, … 55pg, … 65-90Pg, … 150Pg, … 500Pg, … and 537Pg” (Lal, 440). This is a huge range within the estimates, and makes using the data very difficult. Finally, the most important factor limiting the effects of soil degradation to larger climate threads is that “exploratory simulation models… either ignore the soil or assume the presence of some “standard soils” everywhere” (Bouma, 130). The simplification of soil in computer run models is extensive and in return, often forgotten in climate discussions. This should be a large concern in the coming years to put soil into climate conversations and models.

As previously mentioned, soil degradation is not new, nor is it uniquely anthropogenic, so why should it matter this much? The state of our soils should be as important to us as water availability, because it is vital to our survival. Soils play a direct role in our food security, water security, nutrient cycling, waste cycling and carbon cycling. Our planet seems huge, but in reality, roughly 12% of our land is well suited for the production of food and fibre, 24% is grazing land, and the remaining 31% is forest land (Osman, 2014). Furthermore, it is estimated that “2 billion ha of land that was once biologically productive has been irreversibly degraded since 100 AD” (Lal, 438). In the last 60 years there has been a decrease in ecosystem services by 60% (Lal, 2015). These disastrous affects are not subsiding and directly impact every single person on this planet. In July 2009, our population was 6.79 billion people and our arable land was 1.351 billion ha, which yields 0.20ha of cropland per capita. The threshold to sustain human populations is more than twice that, sitting at 0.5ha/capita (Osman, 2014). At the end of 2016, we now sit at 7.46 billion, which brings that ratio to 0.181ha/capita. The state of our soils need to be carefully considered as we move through conversations of sustainability.

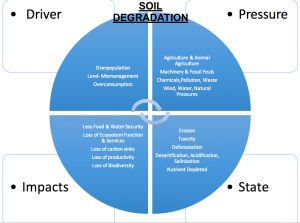
Without a doubt, humans are the main drivers of soil degradation because it is our primary source of acquiring sustenance. Unfortunately, we represent multiple drivers resulting in the pressures felt by the soil. First is our overall population, that is continuing to grow. This not only means more mouths to feed, but there is also more pressure to accommodate all these people, which includes housing, waste management, and resources like timber, brick and infrastructure. A second major anthropogenic driver is our habits of overconsumption. Obesity is considered a global epidemic, and can be attributed to the amount of processed, sugary, salty, and animal based products that we are consuming. As developing countries gain economic wealth, they are choosing the “North American Diet” as well and obesity is spreading across the world. Not only does the average American diet include health risks and increased greenhouse gas emissions, it also affects land availability. Animal agriculture contributes to 30% of the Earth’s landmass for grazing land and land dedicated to growing animal feed. In the United States alone this number is 80% of agricultural land dedicated to animal agriculture (Facts on Animal Farming and the Environment). Overconsumption does not just include the food we consume, but also extends to material goods that are later discarded into the environments polluting our soils. The third anthropogenic driver to highlight is land management, or lack there of. It was Canada’s experience that “the health of soils will continue to deteriorate in areas where intensive agriculture is practised and on low-productivity lands where ecological agricultural methods are not being used” (Forge, 3). Canada was fortunate enough to have the economic backing to reverse the trend of soil degradation however, this is not always the case, “when people are poor, desperate and hungry, they pass on their sufferings to the land” (Lal, 5888).

In response to being overworked, the soils of the world are giving into the pressures of mismanagement and pollution in four major forms of degradation. Our soils are degrading physically from compaction, crusting, reduced infiltration and changing pore geometry. These can be attributed to heavy machinery, agricultural tools, livestock, and temperature changes associated with climate change. Chemical degradation can result in acidification, salinization, nutrient depletion, toxicity, and reduced exchanging capabilities. These types of degradation can come from natural and anthropogenic factors such as slash and burn farming, fertilizers, pesticides, herbicides, fungicides, and processes of leaching. Biological degradation that is affecting our soils can lead to carbon depletion, loss of biodiversity, and increased greenhouse gas emissions. This type of degradation happens predominantly from agricultural mismanagement regimes. Finally, ecological degradation pertains to the disruption of ecosystem functions or services, including reduced productivity and reduced element cycling (Lal, 2015). With our growing need for the soils to produce exponentially, we often turn to “the use of large amounts of fertilizers, pesticides and irrigation to help offset deleterious effects of erosion, but [these] have the potential to create pollution and health problems, destroy natural habitats, and contribute to high energy consumption and unsustainable agricultural systems (Pimental, 1117).

Soil degradation should be considered a wicked problem and taken more seriously because it is leading to larger issues such as deforestation, greenhouse gas emissions, nutrient depletion in our food, erosion, bioaccumulation of toxins, food security and water security. These can all be linked to soil degradation however, it will take a lot of change on the part of many corporations, industries and individuals. Our soils are being filled with chemical pesticides, fertilizers and other sprays which are bringing in millions of dollars annually. This also contributes to fossil fuel consumption. Furthermore, the majority of our crop land is being used to raise animal feed, and there are a lot of Americans who would strongly oppose cutting out large portions of their meat and dairy consumption. There is also the problem of the general public and industry dumping waste that pollutes our soils. In addition, with the majority of our society living in cities, it is hard to instil how important a harmonized relationship with the soil really is, because less and less people are exposed to it. There are so many complexities with our relationship to the soil that makes degradation truly a wicked problem, and one that needs addressing immediately.

The astonishing rates of soil erosion of between 40 and 17 tons ha-1/year-1 lead to global associated costs of $400 billion dollars a year (Pimentel, 1121). The United States has some of the lowest rates of soil erosion, at 17 tons ha-1/year-1, and even so has seen 30% of farmland abandoned due to erosion, salinization and waterlogging (Pimentel, 1117). Soil degradation is expensive and vital to our survival, and has the potential to lead to political and domestic conflicts. Although anthropogenic forces are largely to main drivers of these pressures, conservation and soil stewardship can have lasting impacts, as seen in Canada and elsewhere in the world. Conservation and erosion control techniques are “reliable and proven… [and] include ridge-planting, no-till cultivation, crop rotations, strip cropping, grass strips, mulches, living mulches, agroforestry, terracing, contour planting, cover crops and wind breaks” (Pimentel, 1121).  Furthermore, consumers and municipalities have the ability to help soil degradation through composting and waste management techniques, banning of chemicals used in agriculture and elsewhere, sustainable food choices, and raising awareness to important issues pertaining to sustainability. In the 21st century, knowledge is power, and we all have the responsibility to be educated on the issues that matter for our next generation.

References:

Bouma, J., & Mcbratney, A. (2013, March 22). Framing Soils as an Actor When Dealing With Wicked Environmental Problems. Geoderma, 200-201, 130-139.doi:10.1016/j.geoderma.2013.02.011

Facts on Animal Farming and the Environment. (n.d.). Retrieved fromhttp://www.onegreenplanet.org/animalsandnature/facts-on-animal-farming-and-the-environment/

Forge, F. (1998, August 27). Agriculture Soil Conservation in Canada (MR151e). Retrieved from http://publications.gc.ca/Collection-R/LoPBdP/MR/mr151-e.htm

Lal, R. (2002, November 29). Soil Erosion and the Global Carbon Budget. Environment International, 29(437), 450th ser., 437-450. doi:10.1016/s0160-4120(02)00192-7

Lal, R. (2015, May 13). Restoring Soil Quality to Mitigate Soil Degradation. Sustainability, 7(5), 5875-5895. doi:10.3390/su7055875

Mcneill, J. R., & Winiwarter, V. (2004, June 11). Breaking the Sod: Humankind, History, and Soil. Science Magazine, 304(5677), 1627-1629. doi:10.1126/science.1099893

Osman, K. T. (2014). Soil Degradation, Conservation and Remediation. Dordrecht: Springer.

Pimentel, D., Harvey, C., Resosudarmo, P., Sinclair, K., Kurz, D., Mcnair, M., . . . Blair, R. (1995, February 24). Environmental and Economic Costs of Soil Erosion and Conservation Benefits. Science, 267(5201), 1117-1123. doi:10.1126/science.267.5201.1117

Rajan, K., Natarajan, A., Anil Kumar, K., Badrinath, M., & Gowda, R. (2010, September 25). Organic Soil Carbon – The Most Reliable Indicator for Monitoring Land Degradation by Soil Erosion. Current Science, 99(6), 823-827. Retrieved from http://environmentportal.in/files/Soil organic carbon.pdf

Pacific North West LNG Project – 319 Midterm

For my environmental impact assessment course, we had to review the PNW LNG project and it’s recent approval for our midterm. There were two questions we had to answer and could spend 400-600 words on each. Below is my submission:

QUESTION 1: Does the federal environmental assessment of the PNW LNG facility demonstrate acceptable levels of public participation? Make an argument in response to this, supporting it with examples of participation (or lack thereof) in one or several of the steps of the overall assessment process for the project. Connect these with the topics we have covered in class on the principles and critiques of public participation (potentially including Aboriginal engagement, though not necessarily).

The Pacific Northwest Liquefied Natural Gas project, in my opinion, has shown acceptable levels of public participation, including Aboriginal consultation and public participation. However, this does not necessarily mean meaningful participation. The proponent made tremendous efforts to show public participation which has included open houses, commentary, funding, and ongoing participation through their website. On the other hand, this project has failed to gain “consent, and not simply consultation, [that] is required where Aboriginal title is proved” (Hanna, 161). The project boundaries, specifically Lelu Island, is within five overlapping Aboriginal land rights and titles. These five nations have not all granted their consent to the project even though they have been consulted, and therefore they have not meaningfully participated in this project (Canadian Environmental Assessment Agency, 148). Across Canada, First Nations “right to use and control the land and enjoy its benefits” (Hanna, 162) has not been fully respected, and this is just one more example.

Public participation was encouraged through more than $360 000 of funding to First Nations and an additional $94 200 to the public and interested groups (Canadian Environmental Assessment Agency 21, 24). I believe that this amount of funding is very encouraging for public participation, and the proponent and agency did a good job funding for participation across the board.

The agency, and especially the proponent, held an acceptable amount of public hearings and meetings with interested parties regarding their views on the project. Following a design change, the project notified the public, First Nations, and agency, and held additional hearings for feedback on the changes. In total, the proponent held 12 months of Aboriginal consultation periods between February 2013 and March 2016 that reviewed the project description, EIS guidelines, the EIS and draft EA report (Canadian Environmental Assessment Agency, 22). To further First Nations participation there was the opportunity for the two most affected groups to participate in the archaeological surveys and geotechnical investigation programs on Lelu Island. Further surveys and studies incorporated the five affected First Nations directly through participation on Lelu Island as well as in reviewing the findings (Canadian Environmental Assessment Agency, 23).

The Agency held two public opportunities to review the documents and the proponent held six open houses and over 50 meetings with interested business and groups. Furthermore, the proponent made two storefront locations available for the public (Canadian Environmental Assessment Agency, 24). In addition, in September of 2014, the proponent announced a 45-day extension on the review process to allow for “additional public consultation with First Nations and local communities” (Pacific North West LNG). Other means of contact included phone calls, emails, a toll free phone number, comment cards, an interactive and easy to follow website, newsletters and print materials.

Regrettably, one of the ways in which this project denies public participation is through its emissions. A group of scientists, including many professors at the University of British Columbia, have found that the project will emit 11.5 tonnes of carbon dioxide annually, not including the downstream emissions This amount of emissions annually will make it significantly more challenging for not only British Columbia, but Canada as a country to reach its reduction targets. For this reason, public participation in reducing emissions has been taken away from us (International Climate Change Scientists and Climate Policy Experts).

In these ways the agency and the proponent have done a very good job in engaging with, and giving opportunity for community members and First Nation groups to participate in the Environmental Assessment process and beyond. The proponent has encouraged participation through funding and ongoing relationships and participation outside the obligatory timeframes of an environmental assessment. Their straight forward and interactive website is an excellent public resource and a great first start for everyone to participate, rather than those directly affected by the proposed project. However, this good example of public participation does not guarantee that the projects denial or approval will be in the publics’ best interest.

Word Count: 612

References:

Canadian Environmental Assessment Agency. (2016, February). Draft Environmental Assessment Report – Pacific North West LNG. Retrieved from http://www.ceaa.gc.ca/050/document-eng.cfm?document=104785

Hanna, K. S. (2009). Environmental impact assessment: Practice and participation (3rd ed.). Don Mills, Ont.: Oxford University Press

International Climate Change Scientists and Climate Policy Experts. (2016, May 26). Unjustified adverse greenhouse gas impacts of the Pacific Northwest LNG proposal. [Letter to Catherine McKenna, Minister of Environment and Climate Change.].

Pacific North West LNG. (2014, September 14). EA Review Extension Allows for Additional Consultation [Web log post]. Retrieved from http://www.pacificnorthwestlng.com/media-center/news-releases/ea-review-extension-allows-for-additional-consultation

 QUESTION 2: The mandate for the minister and cabinet in assessing a project is to decide whether there are likely to be significant adverse effects (taking into account appropriate mitigation measures), and if so, whether they are justified in the circumstances. Very recently, the federal government issued an approval for the PNW LNG project. Do you agree with this decision? Make an argument supported by your reading of the documents, your knowledge of the environmental assessment process (for example: principles, objectives, role in decision-making etc) and your own personal perspective.

I do not agree with the decision to move forward with the Pacific North West LNG project. Although I believe that the environmental assessment was generally well done, I do not agree with the Minister of the Environment and the Governor in Council’s decision to justify the resulting significant adverse effects of the proposed project. Although this project contributes to the Canadian economy, it will be detrimental to our pledged emissions reductions and another example of “the practice of consultation and accommodation” rather than consent for First Nations holding land rights and/or title to areas affected (Hannah, 162).   

In the draft environmental assessment report, 11 valued components were identified locally and regionally. Significant residual effects include an increase of greenhouse gas emissions and increased mortality and behavior changes for the federally considered at risk species of harbor porpoise (Canadian Environmental Assessment Agency, 178). Furthermore, numerous articles by showing independent studies conclude that the assessment did not put enough weight on the harmful effects to juvenile wild salmon. The Skeena watershed is the second largest river in Canada to host salmon, and the LNG project would effect salmon not only surround Lelu Island, but upstream as well (Li). In addition, the agency’s analysis of the project concludes that upstream and direct emissions from the project are “high in magnitude, continuous, irreversible and global in extent” (Canadian Environmental Assessment Agency, 39) which is a stark contrast to the general condition to “promote sustainable development” in the decision statement signed by the Honorable Catherine McKenna (McKenna).

This project threatens all Canadians in numerous ways, and should not be approved to move forward. First, studies show that “long-term energy security of Canadians may be compromised” due to current declining production, LNG price decreases, and overestimated export promises (Hughes, 46). Second, the projected revenues for this project “are very unlikely to be realized”. Our “Prosperity Fund” ideal from this project is threatened because the “long-term supplies of gas at low prices are by no means assured, hence neither are the profits necessary to reimburse the very large capital investments required”. Similarly, LNG prices have decreased as well, affecting the projected revenues revenues (Hughes, 46). Third, this project represents global greenhouse gas emissions that should not be overlooked by potential economic opportunity. This project alone would increase provincial emissions by 8.5% and national emissions by 0.75%. Our country has pledged to reduce our overall emissions by 17% by 2020 (Canadian Environmental Assessment Agency, 35), and this facility alone threatens our goal, let alone the cumulative of the 12 LNG terminals the National Energy Board has already approved (Hughes, 45). The government’s justification of this project does not support the best interest of Canadians and should not justify the significant environmental effects based on projected economic revenues.

In addition to threatening energy security, endangering our emissions reduction targets, and significantly effecting the environment, the project’s approval once again limits First Nations “the right to use and control the land” (Hanna, 162) that they have rights and title to. Although the environmental assessment shows adequate First Nations and public participation, the project does not have the full consent from all affected First Nation groups that hold rights and title to the area. This has led to “First Nations and environmental groups [planning] to file lawsuits … against the federal government … and oil firm” (Global News).

The federal government’s decision to approve the Pacific North West LNG project is not a good example of our nation’s climate goals, and should not have been justified by economic means. This project is another example of “Canada and British Columbia [adopting] a de facto strategy of liquidating [our] resources as quickly as possible in the name of the economic prospects of the government of the day” (Hughes, 46). Canadians should be outraged and stand together to show the government what we want as citizens for our country.

Word Count: 615

References:

Canadian Environmental Assessment Agency. (2016, February). Draft Environmental Assessment Report – Pacific North West LNG. Retrieved from http://www.ceaa.gc.ca/050/document-eng.cfm?document=104785

Global News. (2016, October 27). First Nations to sue federal government over Pacific NorthWest LNG project. Retrieved from https://reportca.net/2016/10/first-nations-to-sue-federal-government-over-pacific-northwest-lng-project/

Hanna, K. S. (2009). Environmental impact assessment: Practice and participation (3rd ed.). Don Mills, Ont.: Oxford University Press

Hughes, D. (2015, May). A Clear Look at BC LNG. Retrieved from http://www.policyalternatives.ca/sites/default/files/uploads/publications/BC Office/2015/05/CCPA-BC-Clear-Look-LNG-final_0_0.pdf

Li, W. (2016, November 13). LNG project could threaten young salmon more than previously thought: Study | Metro News. Retrieved from https://cdnpoli.net/links/lng-project-could-threaten-young-salmon-more-than-previously-thought-study-metro-news-357469