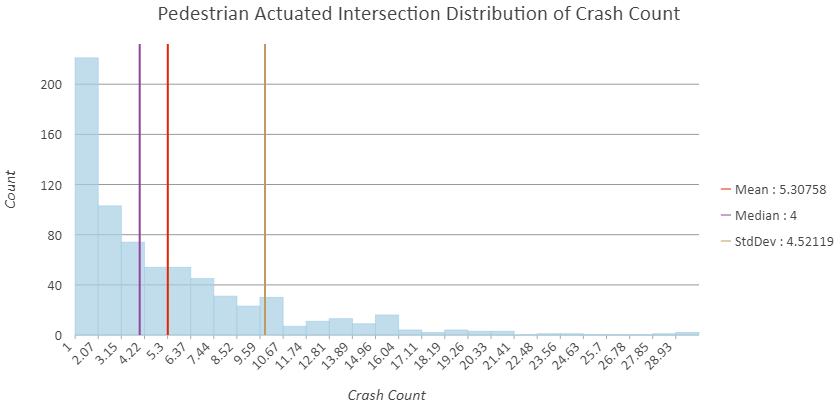
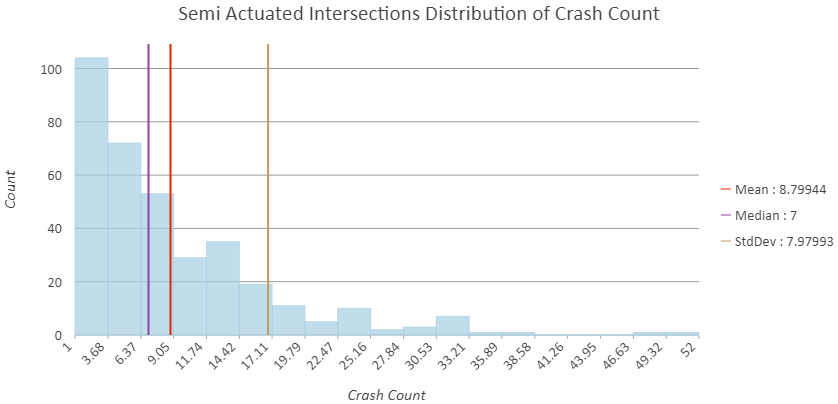
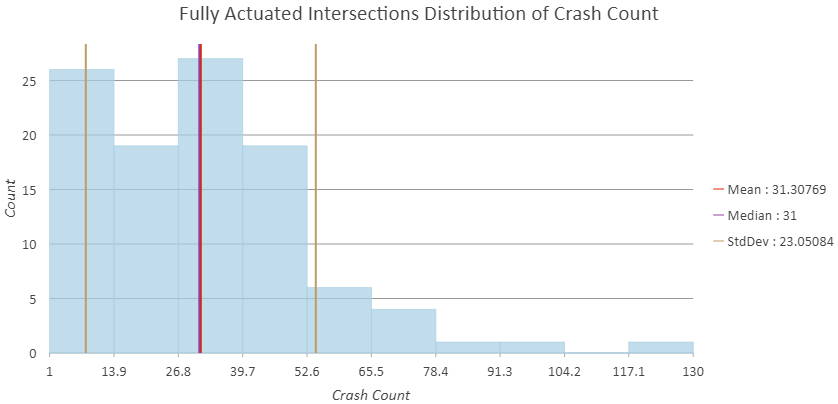
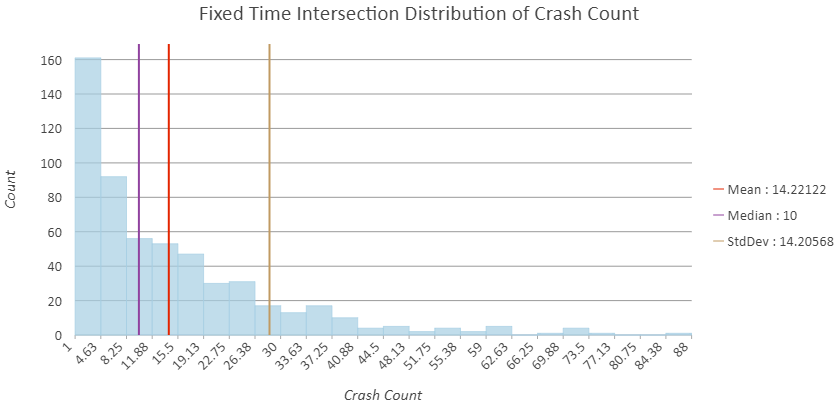
The histograms from the point data containing crash information for each intersection type of interest are shown below; these graphs have identified how many of the same amounts of crashes occurred for each intersection type. The mean, median and standard deviation can help understand the distribution of the data. For example, the fully actuated intersection graph has the same very close mean and median values, indicating that that the dataset is more or less evenly distributed.
The Heat map created is shown below.
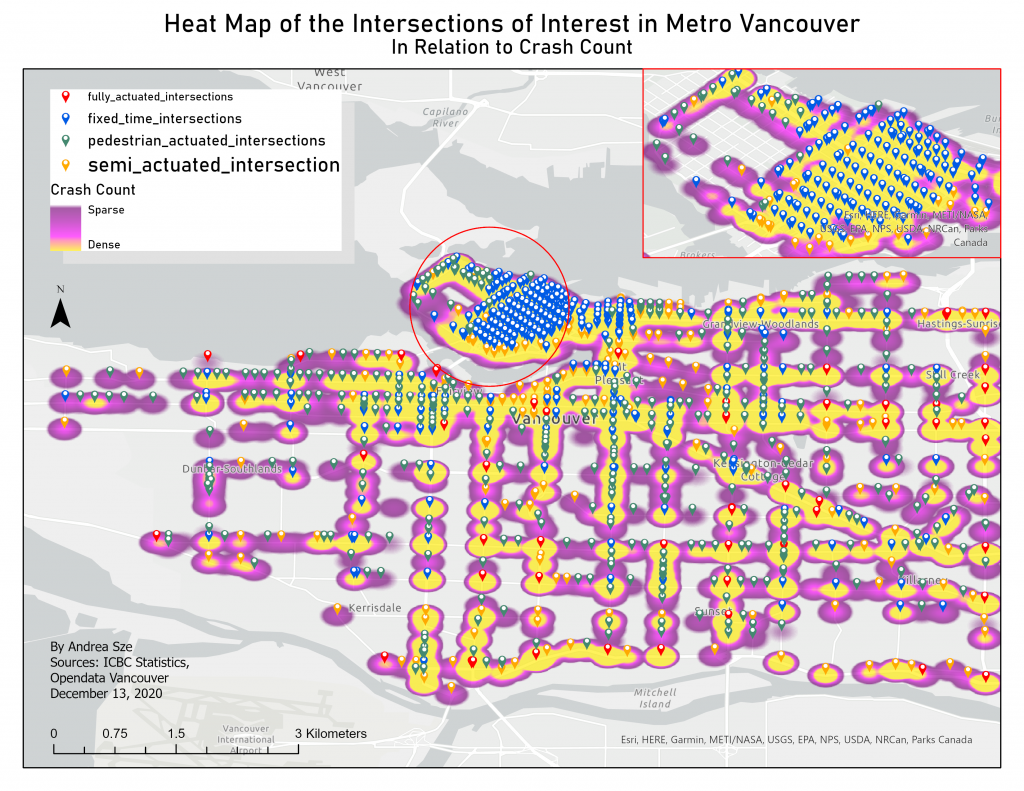
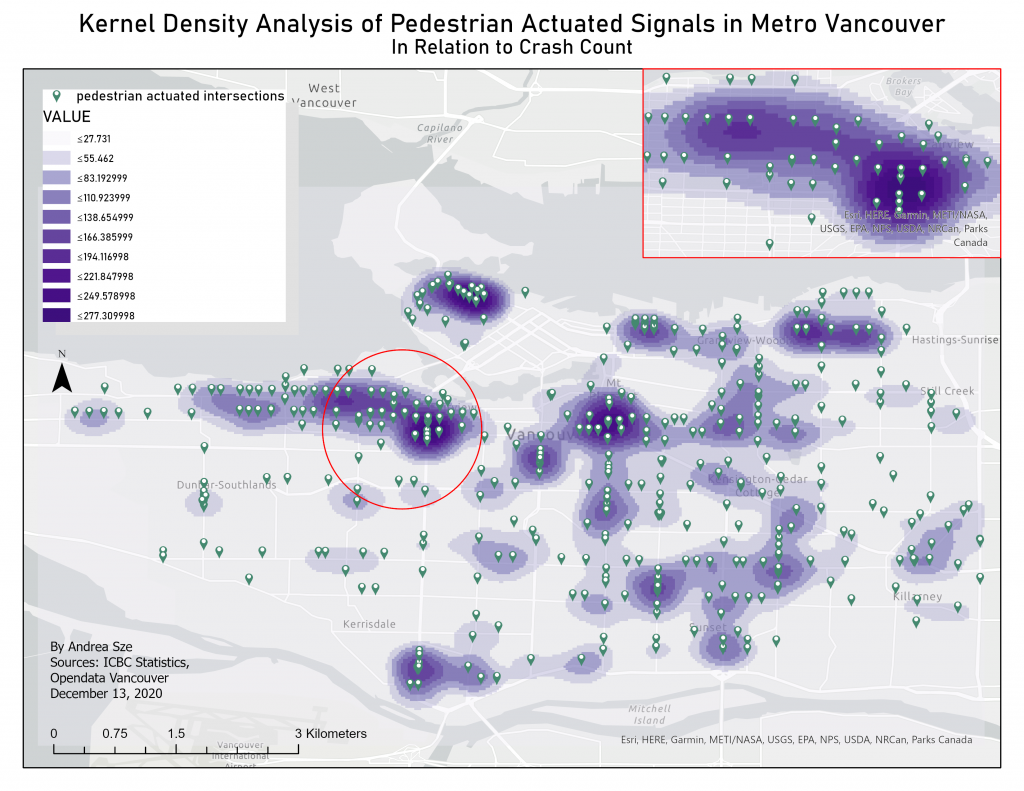
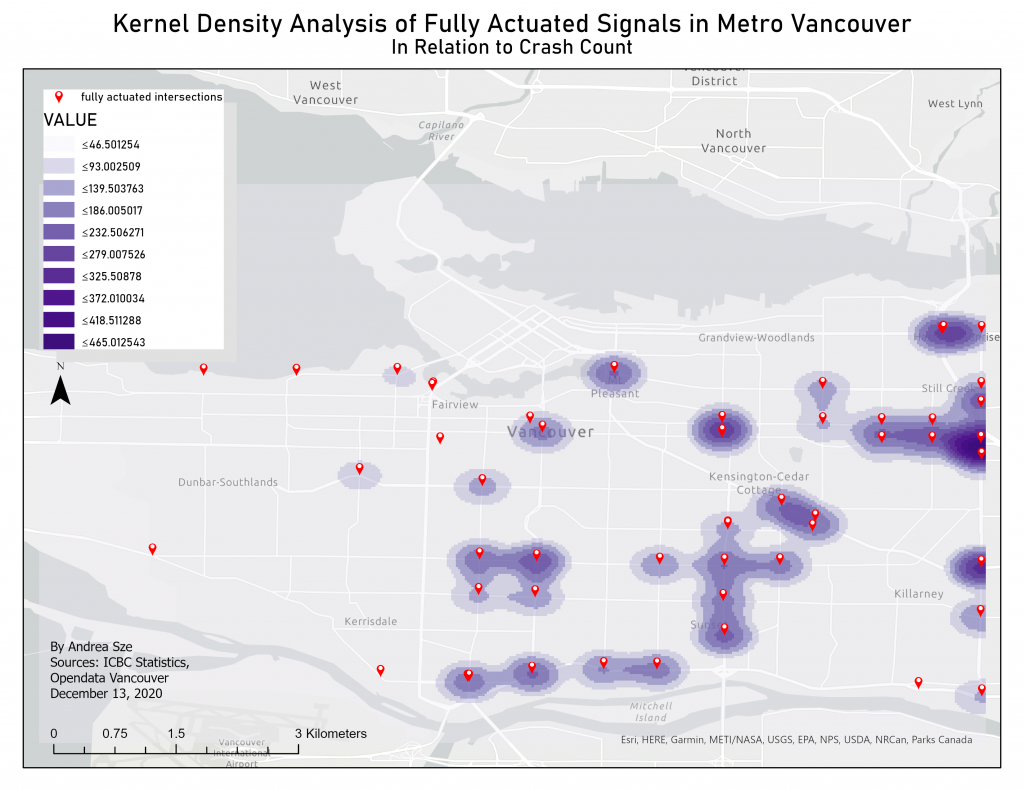
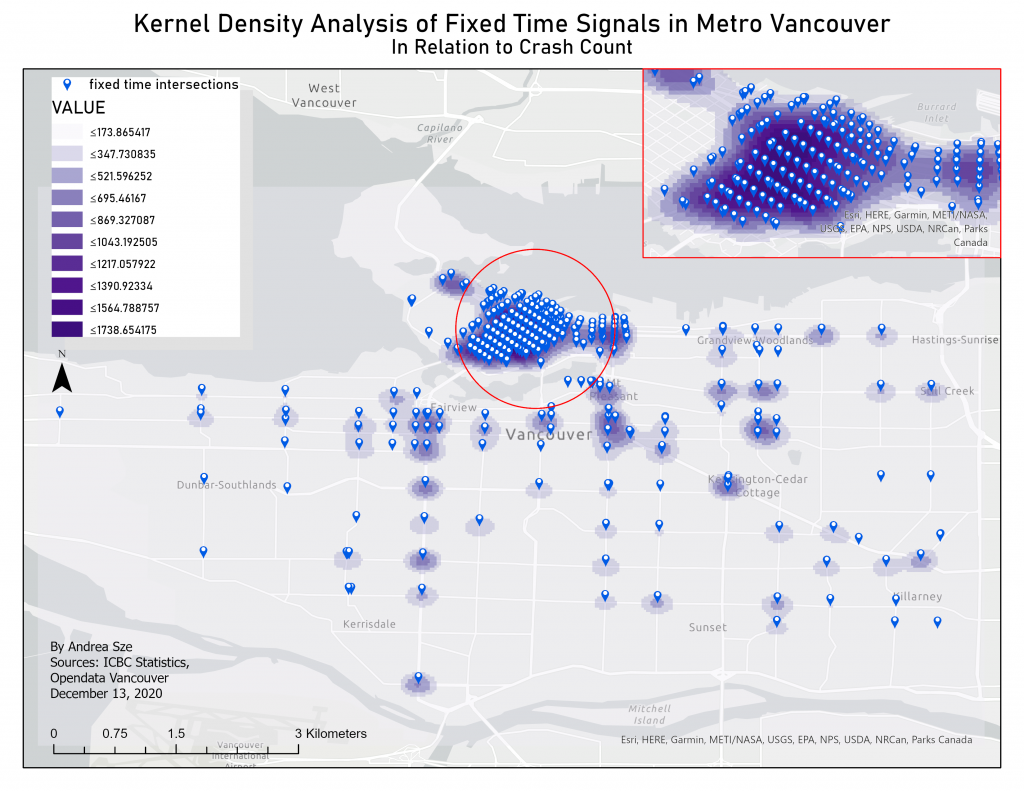
Spatial Analysis done on each of the traffic lights types was symbolized and projected onto a map in a format as consistent as possible with the others so they could be compared even though the statistics are not the same. The Kernal Density Analysis was effective in showing areas of high densities and the occurrence of crashes. The following four maps are the results; each showing a Kernal Density Analysis in relation to Crash Count.