
Methodology
The primary methodology to perform our analysis regarding bald eagle habitats in response to a changing climate is to take advantage of spatial modelling with GIS. Spatial modelling allows us to visualize how different climatic factors work together to create the most suitable habitats that support the survival, growth, and reproduction of bald eagles with various climate models that simulate a future environment. Hence, spatial modelling helps us answer the “what if” question proposed by our project objects that our project aims to investigate. The results of our modelling detect and measure how total suitable habitats change with a changing climate and provide insight of where the most suitable habitats will be. The finding of the project can thus provide guidance on how much efforts need to be taken in order to protect and conserve the bald eagle species within the range of Vancouver Island due to the stress caused by the changing climate and identify the habitats of the highest priority.
In this project, two methods of spatial analysis have been conducted, sieve mapping as well as multi-criteria evaluation, in order to answer different research questions. Sieve mapping overlays areas where all requirements are met for the habitats. Thus, we may project the total change in potential habitats as a result of the changing climatic variables. On the other hand, multi-criteria evaluations have been conducted to select the areas with highest overall climatic suitability, which is a task that cannot be achieved by sieve mapping. In summary, our project takes two different approaches of spatial modelling to show how they may be used separately to answer different questions, but also demonstrates how they may work together to promote a more holistic understanding of the topic from distinct perspectives.
Workflow
Data Acquisition and Pre-processing
Each map is firstly set to have a projected coordinate system of Albers BC in the datum of NAD 1983. The forest data of Vancouver Island is based on the total biomass raster acquired from Hectares BC, imported to the geodatabase, reclassified and extracted by relatively high biomass, converted to vector, and clipped to the boundary of Vancouver Island within the studying area. The elevation raster layer, the DEM data is processed in a similar fashion to select areas with the most favourable elevation on Vancouver Island. Data for water features, coastlines, and cities originally span the B.C. province and are clipped to the study area. Annual climatic variables that represent climate normals and are associated with climate change models RCP 45 and RCP 85 for year 2025, 2055, and 2085 are accessed from Climate BC. Those variables have been carefully examined by research and discussed and three representative variables are selected to be included in the below modelling – (1) MCMT: mean coldest month temperature (°C), (2) MSP: May to September precipitation (mm), and (3) DD<0: degree-days below 0°C, chilling degree-days, as bald eagles are most sensitive to those variables and hence their influences are likely to be more dominant than the other variables.
Spatial Modelling with Sieve Mapping
Similar to processing the biomass and elevation data, to conduct the sieve mapping for each climate model, the MCMT raster, the MSP raster, and the DD<0 raster layers are also reclassified, extracted, converted to polygons, and clipped into the study area. The output polygons identify areas with considerably milder extreme temperature in winters, more precipitation throughout dry summers, and minimized days with below-zero-Celsius temperature.
For each sieve map, multiple data layers are overlayed within the study area: the areas that fall in the range of favorable elevations, identified forests, a union of the buffered zones within close proximity of inland water features and the buffered zone within close proximity of coastline, and the output MCMT, MSP, and DD<0 polygons as discussed above. The intersection of those data layers highlights the areas that have met all requirements given a specific climate model. Buffers of cities are then erased from the intersected areas, producing the final sieve map.
Spatial Modelling with Multi-Criteria Evaluation (MCE)
The first step of the multi-criteria evaluation is to set up the goal, which is to select the most suitable habitats for bald eagles in response to a changing climate. Based on this goal, three climatic factors are chosen to be included, MCMT, MSP, and DD<0, consistent with the choices for sieve mapping modelling. Then, an analytical hierarchy process is used to determine the weights for each factor, as shown in below.
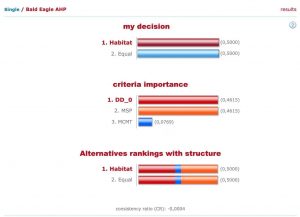
DD<0 and MSP are substantially more important than MCMT, as bald eagles are known to be able to survive extreme weathers. DD<0 and MSP are considered equivalently important, as they exert the major resistance from the temperature and the precipitation aspect. Standardization is then performed to ensure the three factors are normalized to a common scale. The MSLarge function is used in the transformation of MCMT and MSP, as it favours warmer temperature and higher precipitation that increase the overall suitability. The MSSmall function is selected for the transformation of DD<0, since shorter freezing duration creates higher open water availability that bald eagles depend on. With the transformed factors and their corresponding weights ready, the MCE algorithm is then performed to yield the final result given each climate model, with an output of approximately 15% of the area of the Vancouver Island with the highest suitability.
Presentation
Cartography techniques and georevisualization techniques are used to help display and convey our results. As our purpose is to emphasize the change of the potential habitats in response to the changing climate, several sets of maps are compiled based on spatial modelling methods as well as the climate model for the mapped data to aim for the best communication to our audiences.