For this project, we have generated maps based on two different methods: sieve mapping and multi-criteria evaluation (MCE). For both methods, we have created potential habitats for bald eagle in 2025, 2055 and 2085. We have also created a map for normal situation. The climate model being used is Representative Concentration Pathway (RCP). As mentioned before, we are using RCP 4.5 and RCP 8.5 specifically for this project. The setting of the models are areas that are close to water body and forests, MSP is greater than 250mm, DD0 is smaller than 180 days, MCMT is greater than 0°C and elevation lower than 600m. For MCE analysis, the criteria importance we set is DD0 46%, MSP 46%, MCMT 8%. The reason is that temperature and precipitation are both key factors that would affect bald eagle’s choices of habitat (Mundahl & Anthony 2013).
Potential Habitat Map of Bald Eagle in Vancouver Island, BC
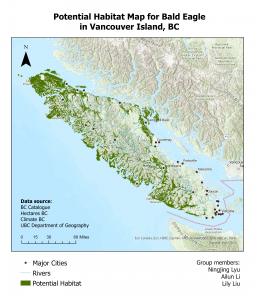
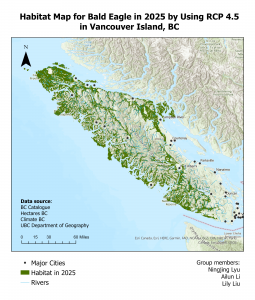
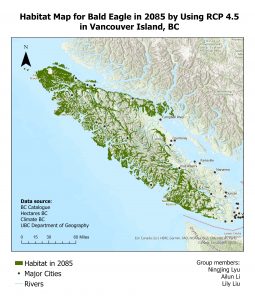
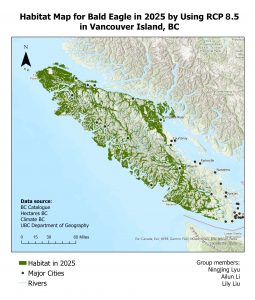
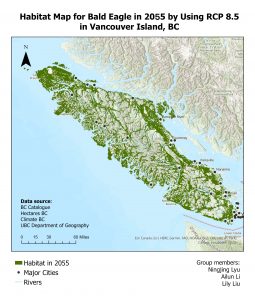
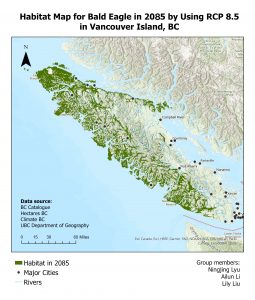
Based on the analysis of sieve mapping, we can see the following results. For the normal situation, the potential habitats for bald eagles seem to cover the coastal regions of Vancouver Island. More habitats can be found on the north-west region of the island. For climate model RCP 4.5, the potential habitat for bald eagles in 2025 is quite similar to the map of normal situation. The potential habitats in 2055 and 2085 gradually decreased based on the maps. The regions that can be potential habitats shrink a lot near Campbell river for year 2055, and the regions shrink more for year 2085. For the climate model RCP 8.5, the situation is worse. The potential habitat for bald eagles in 2025 is quite similar to the map of normal situation. For 2055, there is a slight increase in the habitats on the east coast of the island. However, when it comes to 2085, we have lost almost all of the habitats on the east of the island.
Below are the maps using Sieve Mapping based on two different climate models
RCP 4.5 (2025)
RCP 4.5 (2055) 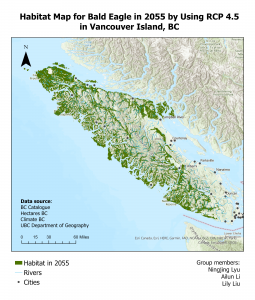
RCP 4.5 (2085)
RCP 8.5 (2025)
RCP 8.5 (2055)
RCP 8.5 (2085)
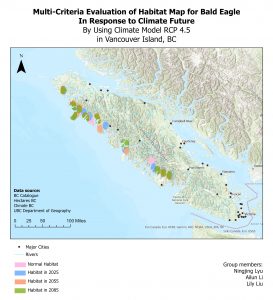
The analysis of MCE shares similar results. MCE analysis helps define the best places that can be habitats. For the normal situation, the potential habitats for bald eagles are mainly found on the coastline that is located on the west of the island. For both climate models, the potential habitat for bald eagles in 2025 is similar to the map of normal situation. The potential habitats map of 2055 and 2085 show a shifting pattern both to the north and south of the west coast. It can be explained by the accommodations to the changing climate.
Multi-Criteria Evaluation Using Climate Model RCP 4.5
Multi-Criteria Evaluation Using Climate Model RCP 8.5

Based on the results of both sieve mapping and MCE, we can conclude that bald eagle habitats would be significantly affected by climate factors. The two methods and the two climate models all show that bald eagles’ habitats would shrink and shift in the future, it is just about how fast the habitats shrink. The main differences between RCP 4.5 and RCP 8.5 are that RCP 4.5 describes the situation where carbon dioxide (CO2) emissions would decline by 2045 and reach roughly half of the levels of 2050 by 2100, and RCP 8.5 describes the worst-case climate change scenarios where emissions continue to rise throughout the 21st century (Vuuren et al 2011). The results of both 2025 maps share similar patterns to normal situation. The reason could be that 2025 is quite close to now and thus there won’t be big differences between 2025 and normal situation. For 2055, there is a decrease in habitats for RCP 4.5, but a slight increase for RCP 8.5. It may be due to the reason such as variations in temperature and precipitation. MCE results can be also affected by the factors that have stronger effects. For 2085, we see decrease in potential habitats again for both RCP 4.5 and RCP 8.5. There would be more regions that are no longer habitats in the model RCP 8.5 since RCP 8.5 is predicting the worst case of climate change.
There are some uncertainty issues for our project. Vancouver Island is in the middle of UTM9N and UTM10N. For our project, we want to focus on area more since we are talking about potential habitats. Therefore, the map projection we chose is Albers since it is a conic projection that preserves area. We also chose DD0 and MCMT to reach the condition that the water body is not frozen. However, this is not an ideal way to assume the situation of water body since we are uncertain about how many days the water is froze as well as how low the temperature needs to be for the water to be froze. There could be other factors that affect the situation of water, and the local situation may not be the same as what we predict. On the perspective of biology and zoology, bald eagle is a top predator that any other small changes in the food chain would cause some effects to it. There is also a lot of fishing industry near Vancouver Island that may influence bald eagle’s food availability. These are some of the factors that could be considered in the future research.