I thought I would take this opportunity to provide an overview of Iran’s CO2 pollution and their approaches to addressing the problem.
Air pollution is a problem affecting Iran’s major cities. The overcrowded capital city of some twelve million inhabitants is on the subject of the majority of headlines. pollution holidays are not uncommon, and they are not just for schools. According to Iran’s deputy health minister around 4,500 people died due to air pollution in the first nine months of 2013. In fact, the pollution got so bad in 2009 that the apparently pollution-resistant black crows fled the city in large numbers.
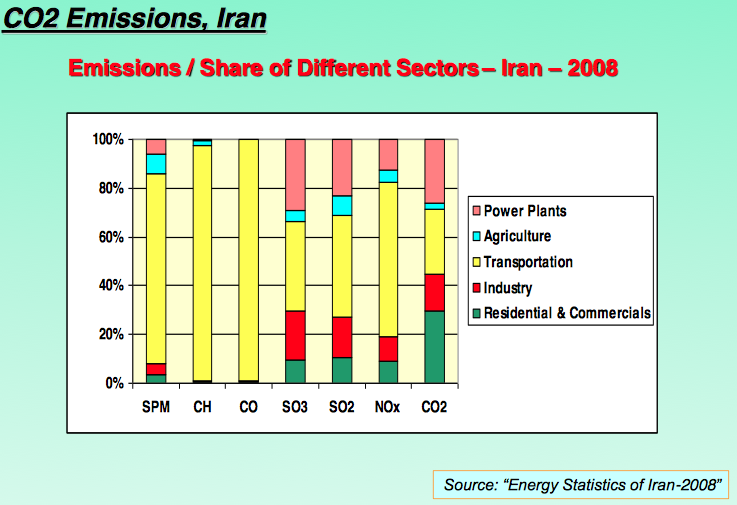
The major cause of this air pollution is the fuel that Iran uses. It is important to first understand how this fuel is used and to what extent by each sector. As of 2008, about 70 percent was used for transportation, 7% by household and commercial purposes, 8% by power plants, 5% by industries and the remainder by agriculture and other activities (Avami & Farahmandpour, 2008). In addition, as of 2010, there were 200 motor vehicles for every 1000 individuals. It is important to note, however, that the majority of the cars produced domestically are not particularly fuel-efficient. Moreover, this number only reflects personal vehicles and does not take into account public transit vehicles as well as the astounding number of motorbikes, most of which are relatively old and are primarily used by lower-income families.
As the diagram below demonstrates, the majority of CO2 emissions can be attributed to residential and commercial sectors as well as to the transportation sector.
At the same time, Iran offers highly subsidized fuel for domestic purposes. The table below shows some of the prices
|
Prices in US Cents/Liter
|
|||||
|
2000 |
2002 |
2004 |
2006 |
2008 | |
| Diesel |
2 |
2 |
2 |
3 |
3 |
| Super Gasoline |
5 |
7 |
9 |
9 |
10 |
Source: Transport Policy Advisory Services, 2009
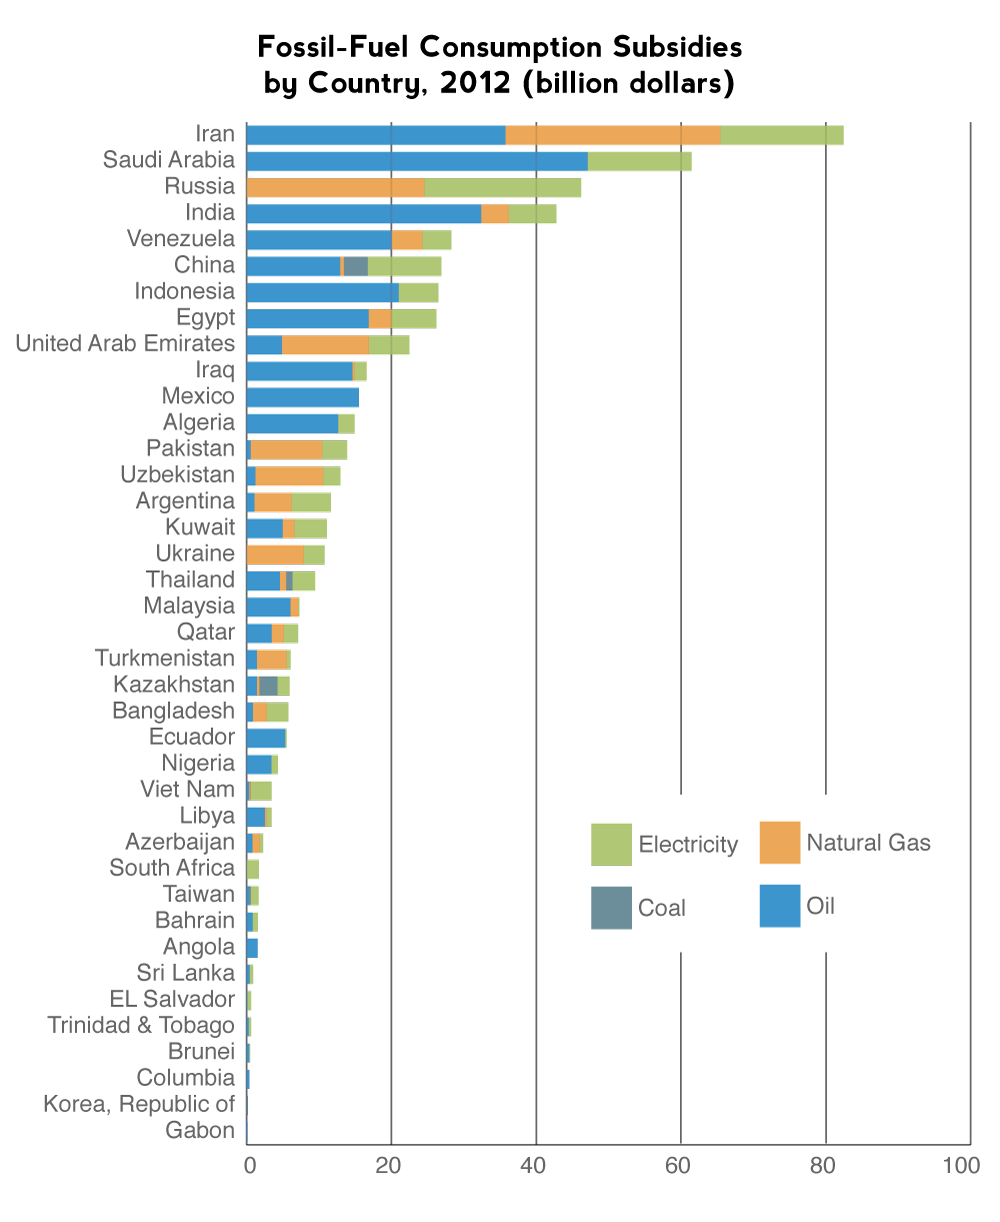
The fuel subsidies that exist in Iran are the largest in the world. As of 2012 they accounted for over 82 billion USD, according to the Institute for Energy Research.
These subsidies have multiple adverse effects. Firstly, they encourage wasteful consumption. Secondly, they permit ignoring much needed innovation in devising more fuel-efficient tools by not reflecting the true costs of superfluous consumption of poor-quality gasoline. Furthermore, even if the prices were at market value, so long as the damages are not internalized any use of fuel would still have great social costs. Thirdly, subsidizing fuels is a great expense on the country and deprives the government from spending this money on more socially beneficial services.
In order to address some of these issues, in December of 2010 Iran implemented a Fuel Price Subsidy Reform Program, with the goal of eliminating all fuel subsidies in the ensuring five years. Whereas previous to the reform program Iranians would pay 10 US cents per liter for normal quality gasoline and 40 US cents per liter for Super gasoline, Individuals would now pay 40 cents a liter for a monthly allotment of 50 liters. Anything above that would have to be purchased at a rate of 70 cents per liter (http://edition.presstv.ir/detail/156109.html). The next step, which will be implemented starting in the Iranian New Year on March 21st, is to raise the quota prices to 70 cents/liter for the first 50 liters in the month and 1$ for any use beyond this. It is important to note that this calculation is conducted using the same exchange rates as in 2010. This is not very accurate given that the Iranian currency has steeply depreciated since late 2011. A more accurate value of the upcoming prices would be 28 cents/liter and 40 cents/liter.
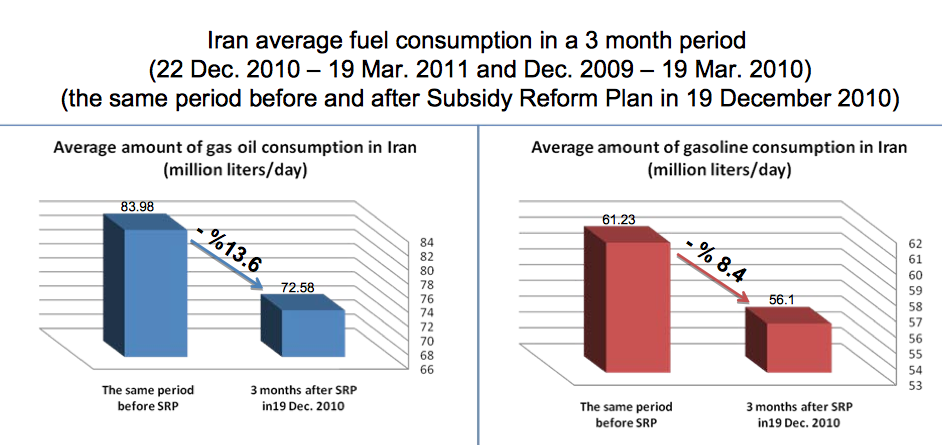
When comparing the consumptions of gasoline and gas oil over a three month period from December to March immediately after the implementation reform program with the same period one year before, a reduction of 8.4 and 13.6 percent, respectively, could be seen.
In 1975 Iran passed the National Clean Air Act. Since then the 1995 Clean Air Act, which requires inspection of motor vehicles to meet the required environmental standards, has been passed. In addition, there is the Air Pollution Emissions Standards of 1998, which applies to all cars, imported or domestically produced. In 2005 Iran stopped producing the Paykan, originally a British card from the 1960s that stuck around in Iran much longer than it should have. These inefficient cars, and others like it, are collected by the government, with the owners provided with low-interest loans, in addition to some monetary compensation, for purchasing of more fuel efficient cars.

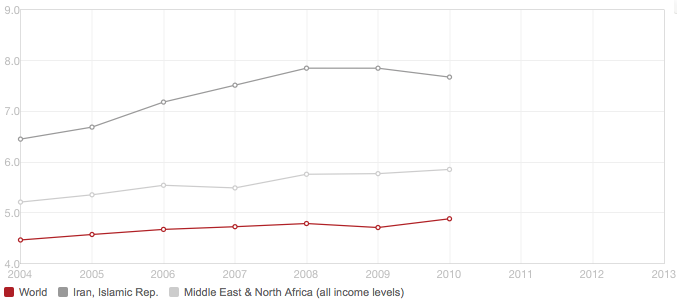
Despite these laws and others like it, no specific carbon tax in place as of yet, resulting in increases in both total CO2 emissions and CO2 emissions per capita. This might be because the population would not be very receptive to the notion as years of using fossil fuels without a second thought to the adverse effects of it might be a difficult to accept. Instead, Iran has recently commenced conducting studies regarding creating a cap-and-trade system like China or Mexico. Cap-and-trade systems generally have higher administration costs and are not as effective as taxes because they cannot be extended across time, i.e. people cannot be allowed to borrow from future credits. This results in the system not internalizing the costs as well as the tax system. In addition, since the majority of Iran’s carbon emission are due to consumer behavior through transportation or residential/commercial uses, it is very difficult, or more likely impossible, to implement this cap-and-trade system at the end-user level.