Part 1: Intersection Analysis
Data Sources
| Dataset | Description | Source |
|
ICBC Reported Crashes
|
Provincial Car Insurance Authority Filters: Years: 2019 and 2020 Municipality: Vancouver Cyclist Flag: Yes |
https://public.tableau.com/app/profile/icbc/viz/ICBCReportedCrashes/ICBCReportedCrashes Data was exported as .csv format |
| BikeMaps |
Crowdsourced database Filters: Time: Dec 2018 – Dec 2021 Incidents: Citizen Collision Reports Citizen Near Miss Reports Cyclist Hazards |
Incidents within the City of Vancouver’s boundaries (excluding UBC/Electoral Area A) were manually inputted into ArcGIS Pro |
| Public Streets |
City of Vancouver Open Data Portal
|
https://opendata.vancouver.ca/explore/dataset/public-streets/information/ Street Segments between Intersections: Segments have streetuse classifications (Arterial, Secondary Arterial, Collector, Residential, Recreational, Closed, Leased) |
| Right-of-way widths |
City of Vancouver Open Data Portal
|
https://opendata.vancouver.ca/explore/dataset/right-of-way-widths/information/ City of Vancouver legal right-of-way (i.e. property line to property line, not physical curb-to-curb distance |
| Street Intersections |
City of Vancouver Open Data Portal
|
https://opendata.vancouver.ca/explore/dataset/street-intersections/information/ Point data for the intersection of two or more City streets or alleyways |
| Bikeways |
City of Vancouver Open Data Portal
|
Includes Street Segment Type, Bikeway Type, AAA Network/Segment: Yes/No |
| Street Width Averages |
Mountain Doodles: Vancouver Streets and Lanes: How Much Space is Taken up by Roads Right-of-Ways? |
https://doodles.mountainmath.ca/blog/2018/06/04/vancouver-streets-and-lanes/ Blog by Jens Von Bergmann, post published June 4, 2018 |
Data Cleaning and Transformations:
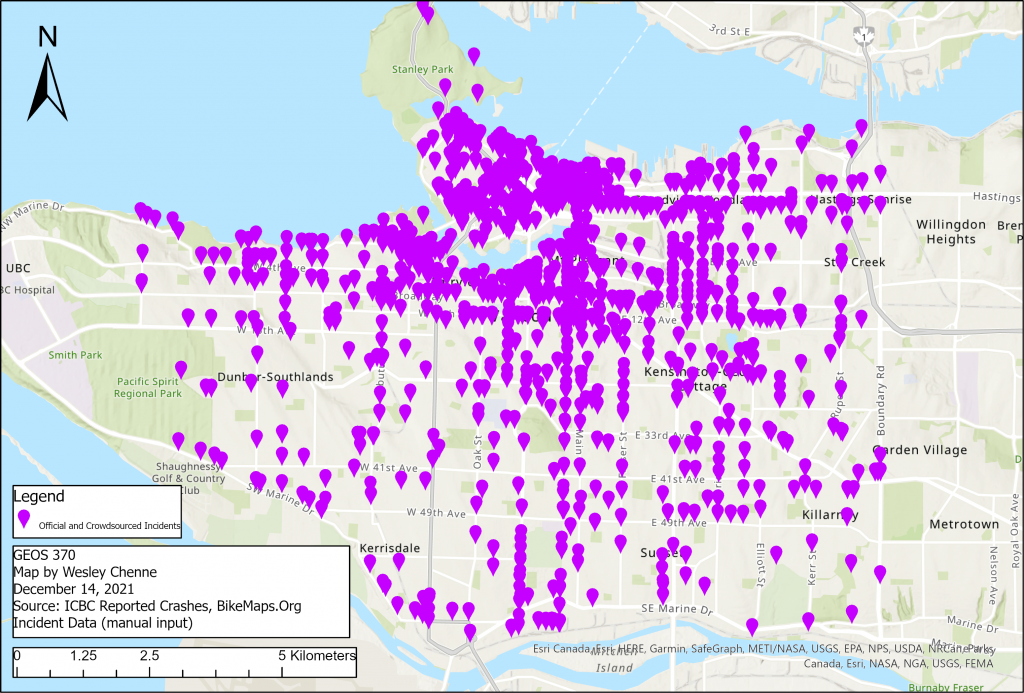
For ICBC Reported Data, official crash/collision data was filtered for the 2019/2020 year to include crashes located within the city of Vancouver and involving cyclists. This data was exported as a .csv file and was imported as a point feature. BikeMaps Incidents, filtered from December 2018 to December 2021 and including collision reports, near miss reports, and cyclist hazards, were manually entered as point data. These two feature classes were combined into a single point data feature class for bike incidents, combining official collision data and crowd-sourced collision, near-misses, and hazards.
To focus on bike incidents occurring close to intersections, it was necessary to define the physical scope of what constituted an intersection. It was clear that not all street intersections are equal in size, so creating a standardized polygon buffer around each street intersection would be less accurate. It can be reasonably expected that for larger intersections, incidents occurring in a wider buffer zone can be considered to have taken place within or leading to the intersection, compared to smaller intersections.
The next step relied upon a data transformation framework set out by Vancouver data scientist Jens von Bergmann (2018), which approximates street width using the right-of-way width point data from the City of Vancouver’s Open Data Portal. Right-of-way width data constitutes the legal right-of-way under city jurisdiction from property line to property line across a street. Although this does not represent the exact measurement from curb to curb, it is an approximation of street width, as properties across arterial roads are generally further apart than properties across residential roads. There can be multiple right-of-way width data points along a single street segment, so in order to introduce this attribute to the public-streets feature class, a spatial join was performed for the point closest to the particular street segment polylines feature.
After joining the right-of-way width attribute to the public-streets segments, there were many street segments that still lacked this data. Analysis from von Bergmann (2018) also found this gap, and chose to use the average known widths for each street type classification as an approximation (see below in Table 1).
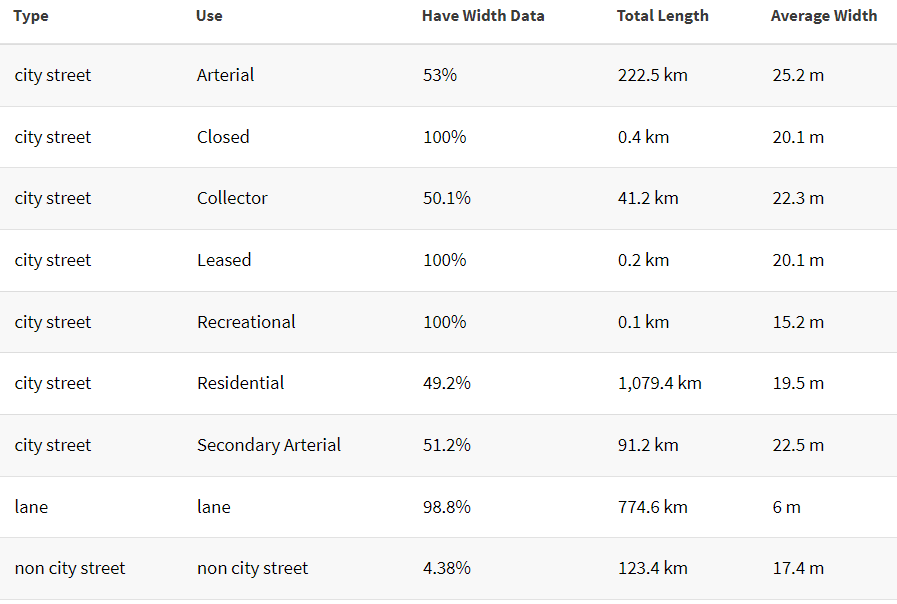
Table 1. Street Width Averages for Street Classifications, as taken from Jens von Bergmann, Mountain Doodles (2018).
This field calculation procedure was followed for the null width attribute fields for each street type, until all public street segments within the city had a width attribute. Next, we joined the segments to each street intersection, summing up the width attributes as a new width attribute for each street intersection point. As a result of this join, two-way street intersections generally have a lower width attribute than three-way street intersections, which generally have a lower width attribute than four-way street intersections.
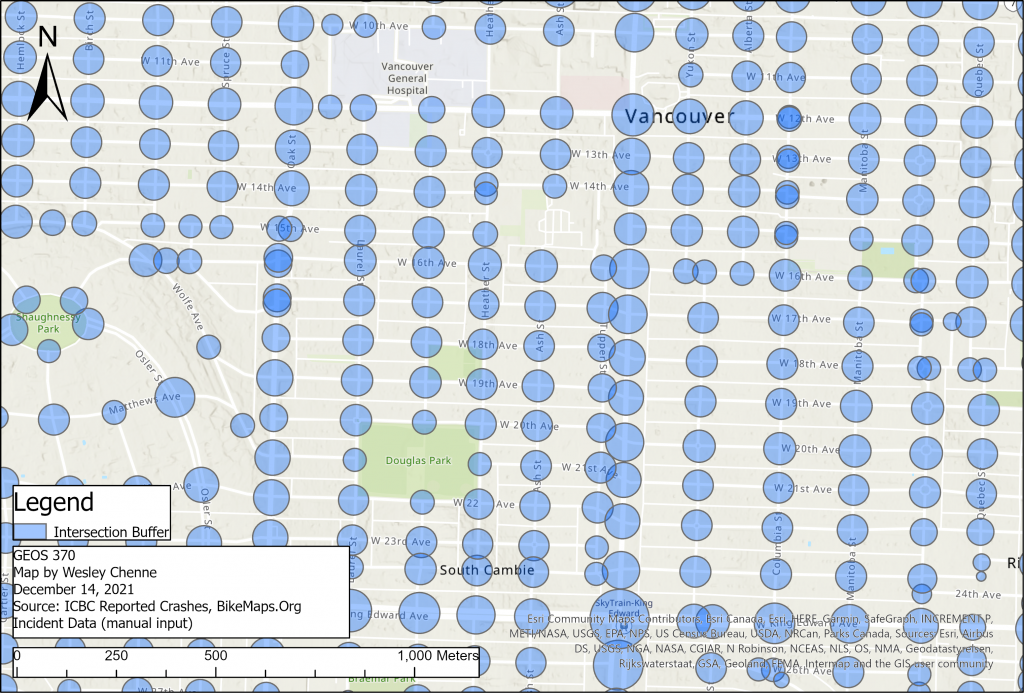
This summed width attribute was halved to provide a field containing the average sum of the average widths of both street segments for each individual street intersection. Also, this generated a more appropriate buffer radius to determine the scope of an intersection, as the original sum of all street segment widths generated many intersection buffers that overlapped. This approximation in the generation of a buffer is acknowledged as an accuracy limitation of the study.
The buffer polygons around street intersections with more streets segments, as well as wider streets are expected to be larger than buffer polygons around street intersections with less, narrower street segments. The results of this buffer generation can be seen below.
Using this street intersection buffer polygons and the bike incidents feature class, an Optimized Hot Spot analysis was performed (using the Getis-Ord Gi* statistic), with only incidents occurring within the buffer polygons, measured by counts, being considered for the hotspots analysis. This first analysis reveals general hotspots and coldspots for bike incidents.
Next, an Optimized Outlier Analysis, also constrained with the buffer polygons and measured by counts was performed for an outlier analysis. This allowed us to isolate four types of results: Hotspots occurring in “cold” neighbourhoods, Coldspots occurring in “hot” neighbourhoods, Hotspots occurring in “hot” neighbourhoods, and coldspots occurring in “cold” neighbourhoods.
Using the public streets feature class, line segments were selected with the street-use attribute as Arterial, Secondary Arterial, or Collector Streets (Major Streets). By visual inspection, street intersection hotspots along bikeways, major streets, and the intersections can be identified.
———————————————————————————–
Part 2. Route Analysis: Improving the Accessibility and Connectivity of the AAA Bike Network
Data Sources
| Dataset | Description | Source |
| Public Streets |
City of Vancouver Open Data Portal
|
https://opendata.vancouver.ca/explore/dataset/public-streets/information/ Street Segments between Intersections: Segments have streetuse classifications (Arterial, Secondary Arterial, Collector, Residential, Recreational, Closed, Leased) |
| Bikeways |
City of Vancouver Open Data Portal
|
Includes Street Segment Type, Bikeway Type, AAA Network/Segment: Yes/No |
| Schools |
City of Vancouver Open Data Portal
|
https://opendata.vancouver.ca/explore/dataset/schools/information/ Includes the Name, Address, Location, and Category of schools within Vancouver |
| Rapid Transit Stations | City of Vancouver Open Data Portal |
https://opendata.vancouver.ca/explore/dataset/rapid-transit-stations/information/ Includes stations for three rapid transit (skytrain) lines |
| Zoning Districts and Labels | City of Vancouver Open Data Portal |
https://opendata.vancouver.ca/explore/dataset/zoning-districts-and-labels/information/ Includes zoning polygons and their classifications (Comprehensive Development, Multiple Dwelling, Commercial, Two-Family Dwelling, One-Family Dwelling, Industrial, Historical Area, Limited Agriculture, Other) |
| Digital Elevation Model (DEM) | City of Vancouver Open Data Portal |
https://opendata.vancouver.ca/explore/dataset/digital-elevation-model/information/ Data is generated from LiDAR data collected in 2013 and covers City of Vancouver’s legal jurisdiction. Resolution of cells is approximately 1 meter. |
Data Cleaning and Transformations:
The aim of this section is to suggest areas for roadway improvements to facilitate bicycle commuting within the city. To perform Multiple Criteria Evaluations (MCEs) for the expansion of Vancouver’s AAA Bikeway network, the first stage of this process involves importing location data for key commuter destinations and points of interest: Schools, Rapid Transit (Skytrain) Stations, Zoning Districts, and the existing Bikeway network. For zoning district data, we are primarily interested in Commercial and Comprehensive Development; the remaining zoning polygons were deleted from this feature class. For the bikeway data, only segments that were classified as being part of the AAA network or AAA segment were selected for and retained.
Next, a buffer distance of 300m was used to create buffers surrounding each of those features. This distance was chosen from literature indicating a reasonable walking distance for cyclists to their ultimate destination (Banerjee et al., 2020). However, vector polygons are not suitable for MCEs. Instead, these polygon buffers are used as guides for the creation of raster features using Euclidean Distance tools (and for the subsequent normalization/transformations of these rasters).
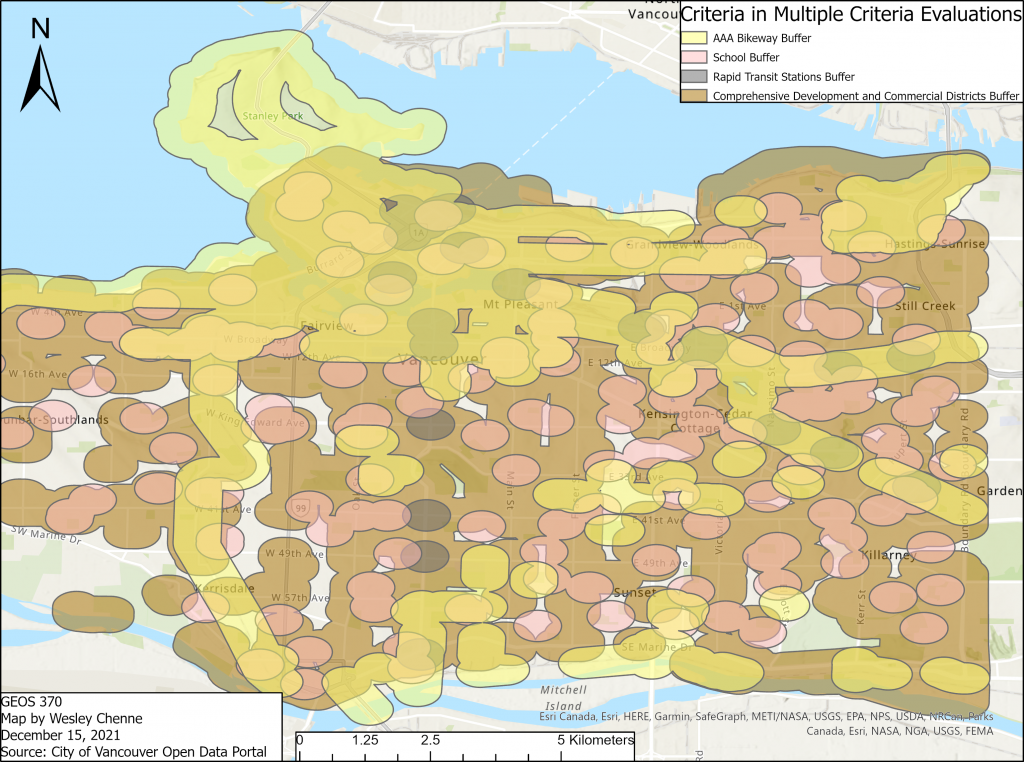
The city of Vancouver’s design guidelines for AAA Bikeways also encourage limited elevation changes (slopes), suggesting that a maximum grade of 3% be preferable for longer distances due to the challenges of biking on hills for riders with greater physical limitations, with suitable grades up to 5% also tolerable for distances up to 500 metres (City of Vancouver, 2017). To introduce slope data for street segments, Vancouver’s Digital Elevation Model (DEM) was imported, transformed to the projection system utilized in our other layers, then transformed into a slope raster using the Slope function. This raster data was then imported as an attribute field for the public-streets feature class. Given that slopes can vary through for a particular street segment, the average slope (in this raster, the Z-mean value) was chosen to be assigned to each street segment line.
Next, the first MCE was conducted for the purposes of expanding the AAA Bikeway network to areas without many AAA Bikeways (i.e. increasing accessibility/coverage of AAA-suitable bikeways). The transformation functions for each criteria, as well as the weighting of the criteria can be found below. As mentioned prior, the buffer feature classes were used for visual comparisons and adjustments to the transformations of the criteria, to ensure that the transformed rasters approximated these 300m buffers around the points/areas of interest. One limitation of these MCE transformations are the subjective assumptions made in choosing these specific transformations, as well as the particular numerical transformation metrics selected for visual matching of previously generated buffer polygons.
| Criteria | Transformation and Rationale | Weights |
| Rapid Transit Station | MS Small. Preference for walking (instead of being able to bike) to and from a Rapid Transit Station quickly diminishes (time-priority) | 25% |
| Zoning District (Commercial or Comprehensive Development) | MS Small. Preference for walking (instead of being able to bike) to and from commercial/CD zones quickly diminishes (time-priority) | 25% |
| Schools | Small. Preferences for walking to school with bicycles do not drop off as quickly with distance increase (safety-priority) | 25% |
| AAA Bikeways | Large. Preferences for further distances away from areas dense with AAA Bikeways, although this does not completely preclude connections to AAA Bikeways (safety-priority) | 25% |
Table 2. MCE of AAA Bikeways Accessibility Expansion: Transformations and Weights for Input Criteria
From these weights, a suitability map was generated. The locate regions tool was used to identify suitable locations for expansion of the AAA Bikeway network. Parameters chosen that differed from the default included the choosing of 10 regions, with the selection method being the highest sum of suitability, and the shape/utility tradeoff being 10% (a cell’s suitability value being strongly weighted over shape). These locations were then converted into polygons.
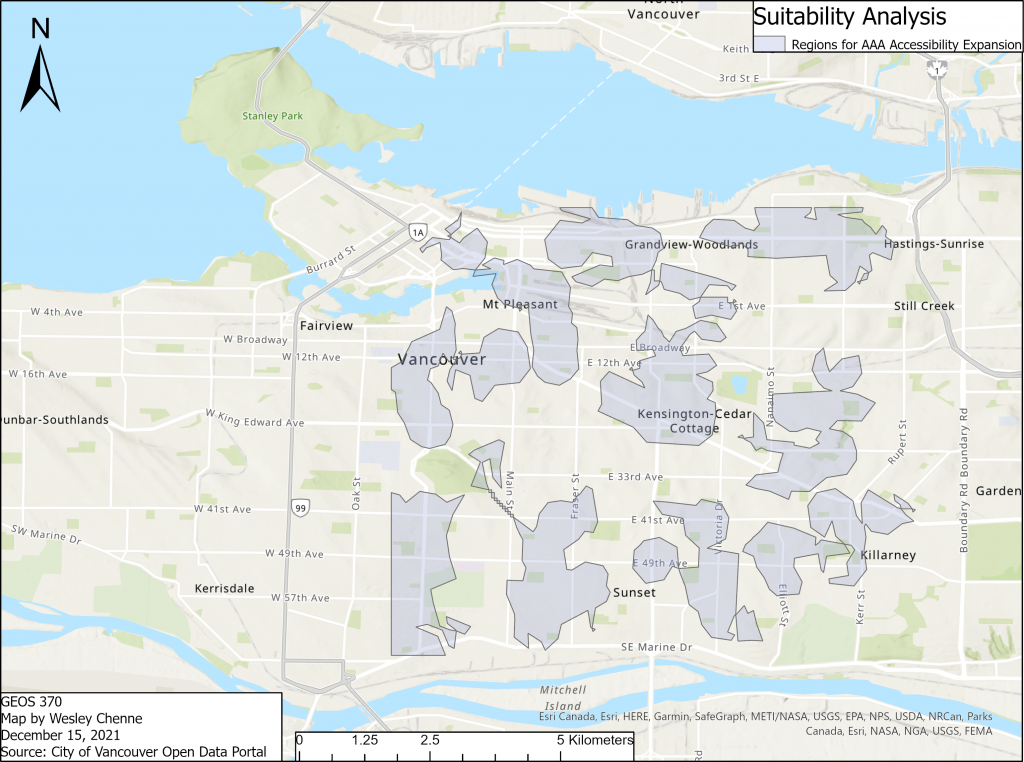
Spatial joins to the public streets feature class were used to find street segments located within these suitable locations. Finally, only street segments with an average slope (Z-mean score) of less than 3% were selected. These street segments are the MCE proposed street segments for expanding accessibility in Vancouver’s AAA Bikeway network.
Next, a MCE analysis was performed for the purposes of expanding the connectivity of the AAA Bikeway network. The transformation functions for each criteria, as well as the weighting of the criteria can be found below. As per above, the buffer feature classes were also used for visual comparisons and adjustments to the transformations of the criteria, and limitations of these MCE transformations include subjective assumptions in transformation choice and numerical transformation metrics selected for visual matching of previously generated buffer polygons.
| Criteria | Transformation and Rationale | Weights |
| AAA Bikeways | Small. Large preferences for closer distance to areas dense with AAA Bikeways, although this does not completely preclude further distances to AAA Bikeways (safety-priority) | 50% |
| Rapid Transit Station | MS Small. Preference for walking (instead of being able to bike) to and from a Rapid Transit Station quickly diminishes (time-priority) | 16.66% |
| Zoning District (Commercial or Comprehensive Development) | MS Small. Preference for walking (instead of being able to bike) to and from commercial/CD zones quickly diminishes (time-priority) | 16.66% |
| Schools | Small. Preferences for walking to school with bicycles do not drop off as quickly with distance increase (safety-priority) | 16.67% |
Table 3: MCE of AAA BIkeway Connectivity Expansion: Transformations and Weights for Input Criteria.
A suitability map was generated from the MCE, then the locate tool used to identify suitable locations for expanding the connections to the AAA Bikeway network. Parameters that differed from the default included the choosing of 10 regions, with the selection method being the highest sum of suitability, and the shape/utility tradeoff being 10% (a cell’s attribute value being strongly weighted). These locations were then converted into polygons.
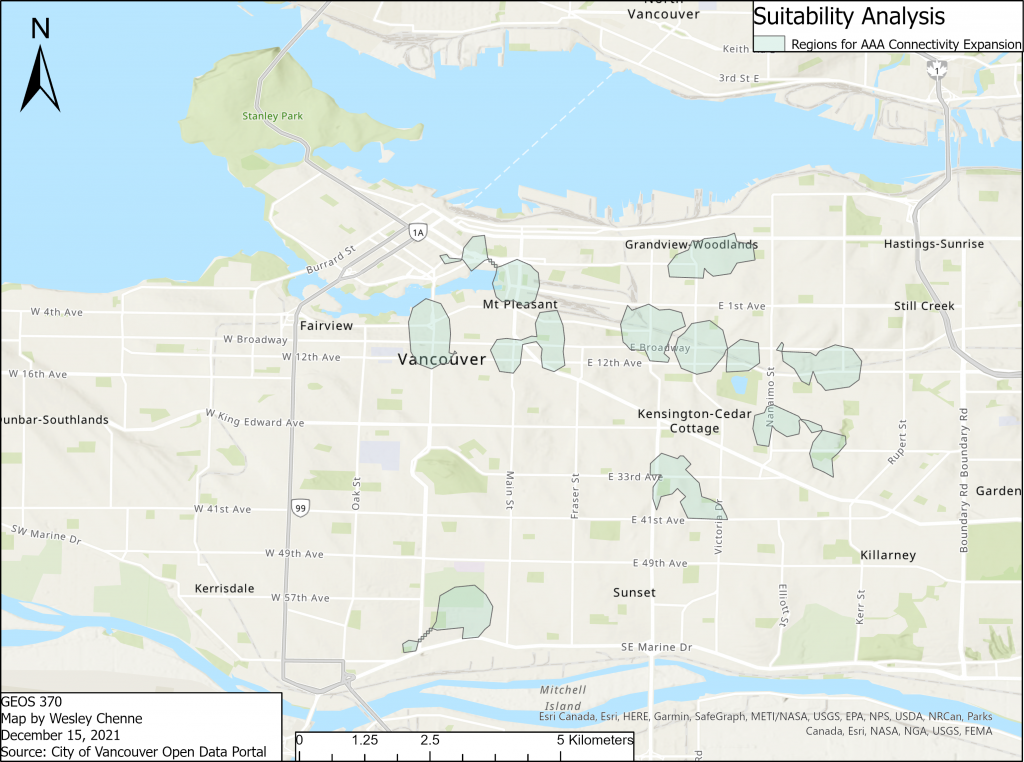
Spatial joins to the public streets feature were used to find street segments located within these suitable locations; street segments with an average slope (Z-mean score) of less than 3% were selected. In order to ensure that there is minimal overlap between the current AAA Bikeway network and the proposed streets for expansion, the AAA Bikeway network was used for pairwise erasure of the street segments which were already part of the AAA network. These remaining segments are the result of the MCE for the expansion of connections of Vancouver’s AAA Bikeway network.
