Part I. Intersection Analysis
An optimized hot spot analysis and an optimized outlier analysis for incident point data were conducted, bounded by the scope of street intersection buffers.
The optimized hot spot analysis displays statistically significant hot and cold spots for incidents occurring within intersection buffers, shaded to indicate the level of confidence based on a normal distribution. As the polygon buffers are a bounding factor for the combined incident point data, only incidents occurring within these polygons are used as the count (score) for the feature. This analysis is based upon the Getis-Ord Gi* statistic, which calculates the significance based on the score for the feature itself and the score of neighbouring features. As described by ESRI (2021a), more statistically significant hot spots (higher z-scores) reflect a more intense clustering of high scores (more accidents within polygons and their neighbours). The reverse is true for cold spots. Hot and cold spots analyses have been used in traffic/transportation literature to indicate general areas where accidents occur (Columbia University, n.d.; Satria & Castro, 2016). These results may provide general areas where researchers and transportation planners can improve bike facilities, or instigate roadway design and traffic management strategies that may reduce future incidents. Real world actions also support these findings, as the City of Vancouver has planned and completed many bike facility installations on many streets in its downtown core during the 2018 to 2022 timeframe (City of Vancouver, n.d.)

To further isolate intersections that may require more specific attention and observations, an optimized outlier analysis was performed. Similar to the optimized hot spot analysis, the polygon buffers are used as bounds for bike incidents, and counts of bike incidents within each polygon are used to score each polygon feature. Then, this score for the buffers are compared to the neighbouring features, and four types of results are generated (ESRI, 2021b). These results indicate statistically significant hot spots and cold spots (known as HH and LL), but also outliers – hot spots surrounded by cold spots (High-Low: HL) and cold spots surrounded by hot spots (Low-High: LH).
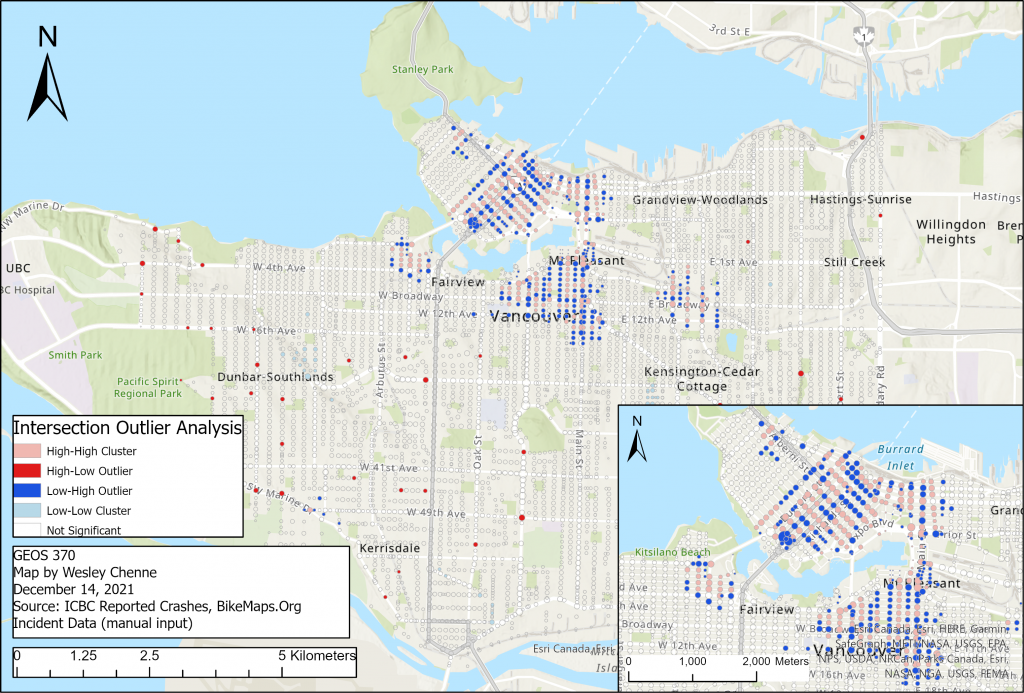
For our intersection analysis, this outlier analysis may be of greater utility, simply because the neighbourhood for which the outlier is contextualized does not include the individual feature itself (ESRI, 2021b). Consider a hypothetical situation where there are a hundred incidents in a year in an intersection crossed by million cyclists a year. As compared to an intersection where there are only ten incidents a year, but that is only crossed by hundred cyclists, this first intersection will likely be considered to be a hot spot compared to the second, but it is more likely that the second intersection will be considered to be an outlier, and warrant further investigation.
Research has indicated that intersections are a cause of stress during a commuting trip, due to safety considerations caused by the increased potential for cyclist/vehicle or cyclist/cyclist interaction (HUB Cycling, 2019). This crossing metric roughly follows an infrastructural hierarchy: crossing an primary arterial street from a residential street ranks higher than crossing a laneway from a residential street (Lowry et al., 2016). On the other hand, crossing a local street while on an arterial does not elicit this crossing stress, but this is countered by expected link stress caused by travelling along the major road (Lowry et al., 2016), assuming there are no bike facilities to improve the cycling experience.
It was expected that the majority of bike incidents occur along bikeways, or what can be termed major streets (arterials/secondary arterials/collector streets). Further, it was expected that the majority of (high-low) incident outlier hotspots occur at the intersections of bikeways and major streets.
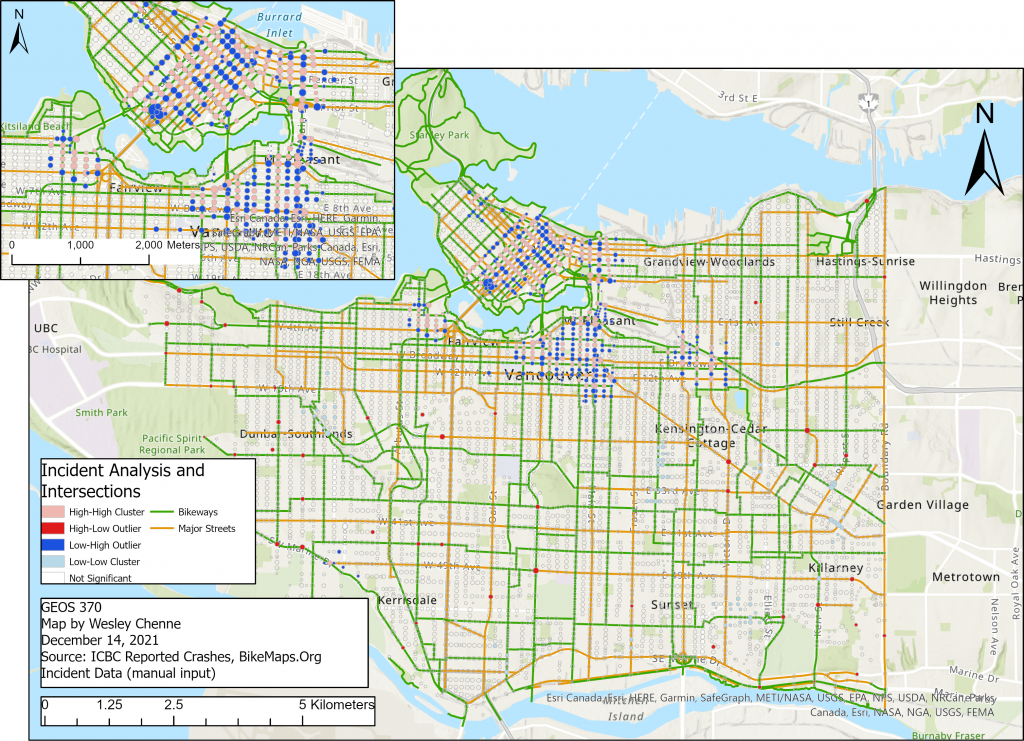
The results of our optimized outlier analysis with the bikeway/major streets overlay indicate that many hotspot outliers occur almost evenly along both bikeways and major streets, although there may be other geographic factors at play. Research has suggested that prioritization frameworks for improving bike facilities may benefit from safety as a focus, due to the benefits in improving ridership and the perception of increased safety, as accident numbers fall (Larsen et al., 2013). In improving cycling safety through modifications to intersections, these outlier hot-spots may be a good place to start. However, given the subjectivity and incomplete nature of the location data from both ICBC (there is some snapping of accidents to intersections) and BikeMaps (crowdsourced data that depends on user knowledge of the database and inputs), hotspots close but not exactly at the intersections of bikeways and major roads should also be considered for infrastructural improvements, or as future bikeway network expansions. As most cities have a limited budget for construction projects, a suggested next step could be traffic and cyclist observational studies of these hotspots, prior to investments in bike facility improvements.
———————————————————————————–
Part II. Route Analysis: Improving the Accessibility and Connectivity of the AAA Bike Network
Two Multiple Criteria Evaluations were conducted, directed towards the goals of improving AAA Bikeway (1) Accessibility and (2) Connectivity in order to broaden the range of potential cycle-commuters. These MCEs located the best areas for expanding Vancouver’s bikeways based on criteria including proximity to schools, commercial and comprehensive development (C&CD) zoning districts (a proxy for job-sites), rapid transit stations, and proximity to the current AAA Bikeway segments.
The first component of this route analysis, Accessibility, aims to suggest street segments in areas where AAA Bikeways are lacking (i.e. not within a 300m buffer), but which are still in proximity to schools (school-aged commuters), C&CD zoning districts (working commuters), and rapid transit stations (commuters of all ages looking to bridge the last mile(s) to their destinations). This allocation framework is in line with the essential factors referenced in Banerjee et al. (2020): attractiveness (school and work destinations), proximity (distance decay raster), and demand (rapid transit stations come with an inherent population group, a subset of which requires further transportation to their destination). The last component, a reverse-scored criteria for distance from current AAA Bikeway segments, is an attempt to increase the equity and potential spread of the AAA Bikeway network.
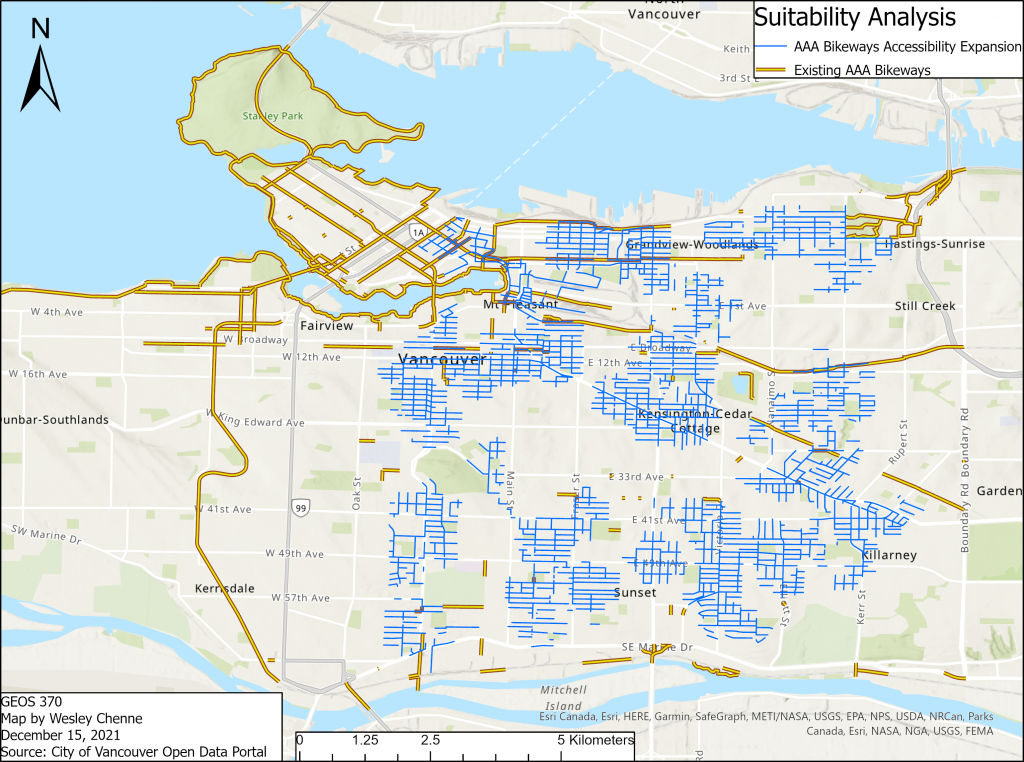
The MCE accessibility result proposes areas for expansion mostly located in what is regarded as East Vancouver (Ontario street eastwards), which is to no surprise as the western-most rapid transit stations (as of December 2021) are located along Cambie street (a few blocks west of Ontario street). Thus, a MCE that did not include proximity to rapid transit as a key factor may have suggested areas of expansion located further westwards. However, it is important to note that these areas for expansion are generally in alignment with other contemporary analyses by biking advocacy groups. HUB Cycling’s (2019) analysis of Vancouver’s bike network notes some gaps in area coverage for routes “Comfortable for Most” (a lower standard than AAA), particularly in midtown (between 14th and 28th Ave), South Vancouver (between 45th and 59th Ave), and in general, around the eastern, southern, and western edges (UBC/Electoral Area A, not included in the scope of the project).
In contrast to the first component of the route analysis, the second component, Connectivity, aims to suggest street segments predominantly where AAA Bikeways are already present, in an attempt to make the street network more AAA-friendly. This MCE still retains proximity to schools (school-aged children), C&CD zoning districts (workers), and rapid transit stations (commuters of all ages) as important, but at a third of the weight compared to proximity to the current AAA Bikeway segments. Thus this deviates from the allocation framework proposed in literature by adding the additional factor of connectivity. This was based on literature which suggests that non-frequent bike commuters tend to select routes that maximize bike facilities (Branion-Calles et al., 2017), which may play a role in encouraging them to become new cycle-commuters.
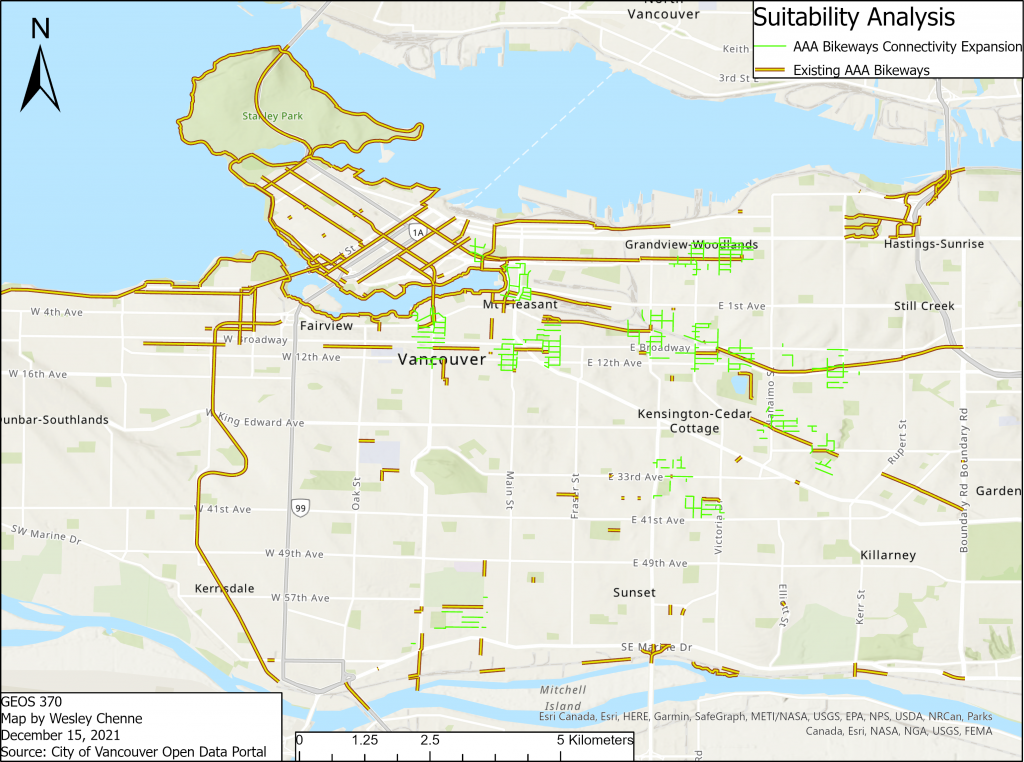
The results from the MCE connectivity locates reveal a dense network of connected streets. These potential areas of connectivity are more strongly centred around the existing AAA Bikeway network, as expected from our weighted criteria. However, they also overlap with the results from the first MCE, suggesting that should commuting be a priority focus, there are some areas within the city of Vancouver that would benefit from AAA Bikeway expansion, regardless of whether or not accessibility or connectivity is a driving impetus. Comparing the results of the two analyses, the southern areas of East Vancouver are a large focus of the Accessibility Expansion, while this area is largely missing from the Connectivity Expansion.
HUB Cycling (2019) also notes that most of Vancouver’s bikeways are located on quieter, residential roads, which often do not link directly to commercial destinations, as they are usually on arterial roads; this may discourage commuters looking for quick, direct routes to their destinations. Introducing connectivity alongside proximity to desired destinations is also in line with research that suggests potential inroads for increasing cycle commuters through the reduction of “dangling nodes” (bike facilities that are discontinuous), increases in potential short trips, and improvements in arterial roads (Larsen et al., 2013). Further literature on cycling connectivity indicates that the continuity of travel on bikeways that are low-stress is a key factor in maximizing the range of potential cycle-commuters (Lowry & Hadden-Loh, 2017). As a result, this project has chosen to retain the proposed AAA Bikeway expansion street segments that are part of collector, secondary arterial, and even arterial streets, in order to increase both accessibility and connectivity.
Key to understanding the capability of turning streets into AAA Bikeway segments are the physical characteristics of the street. As mentioned in our methodology segment, streets segments with an average slope of greater than 3% were filtered out of the potential improvement pools for both MCEs, as per the City of Vancouver’s recommendations for AAA Bikeway street design (2017). For other potential street improvements and bike facilities, NACTO’s best practices for these streets (2017) include factors such as managing motor vehicle speed and volume, changing street design depending on form and function of the street, changing the network and operation of a street, and managing interactions with other road users such as pedestrians, large trucks, transit vehicles, and other cyclists. In achieving AAA Bikeway status through expansions of this network, design guidelines suggest physical and programmatic interventions, steps that will require further observation, research and planning.
