- Downloaded, joined and displayed census data (2011) from the Government of Canada which highlighted the spatial relationship of shelter cost and median income based on census tracts for Vancouver, BC and London, ON.
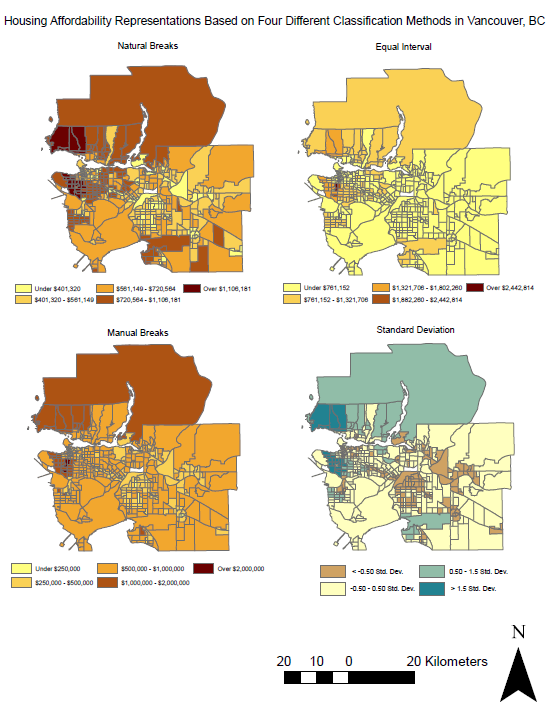
- Utilized various quantitative data classification schemes to display housing data.
- Used ratios to represent data according to an established housing affordability index.
Question pulled directly from the lab: Since you are a journalist, putting together maps of housing cost in Vancouver, which classification method would you choose for your audience and why? What if you are a real estate agent preparing for prospective home buyers near UBC? Are there ethical implications for your choice of classification method? The data is from 2011 – it is now 2017 – should you even been using this data?
A: If I were a journalist, I’d use equal interval due to its simplicity for the readers. If I were a real estate agent, I’d use manual breaks and enter the values in that best represent the customer’s price range (e.g. anything in red they can’t afford, and the colors get lighter closer to their price range). Of course, there are ethical implications when selecting a classification method – data could be represented in certain ways that could skew the map reader’s view. For example, manual breaks could be entered in such a way that make a place look more pleasing to live. Along with using more pleasing colors, a map creator could attempt to create a different message to reader (perhaps in marketing campaigns?). Since this data is from 2011, ideally, we would not be using it but since it is the most recent available there is no way around it. Using this data for any financial advising would not be advised since a lot can happen in six years, and a warning would have to be displayed to any potential map user.

Figure 1. Housing affordability representation based on four different classification methods in Vancouver, BC.

Figure 2. Housing affordability comparison of Vancouver, BC and London, ON.
Figure 2 (above) uses the Housing Affordability Ratings from the Demographia International Housing Affordability Survey which is a ratio of median house price to median household income. The ratios are as follows:
Affordable: 3.0 and under
Moderately Unaffordable: 3.1 to 4.0
Seriously Unaffordable: 4.1 to 5.0
Severely Unaffordable: 5.1 and over
It is clearly a better measure of housing affordability than simply using housing cost alone because it takes into account the income of the people living in the area – the home buyers. These ratings have undergone several peer reviews and intense discussion through the survey and are to be trusted as the best housing affordability index available. The affordability index is directly related to the city’s livability. If one is to enjoy life in the city, they must be able to afford their housing and accommodation. I know first-hand as a visiting student from Alberta, the cost of housing in Vancouver is the primary concern I have for establishing myself here although I love the city, the area and the people.
