The results of our multi-criteria evaluation are shown in Figure 7 with red areas indicating the areas of Burns Bog which best met the 4 criteria and therefore have the highest vulnerability. The main vulnerable area is the southwest portion of the bog which happens to be located next to the landfill. There are also tracts of vulnerable sites which follow the runoff pathways. These are not large areas of the bog but the pathways are important to consider due to the transport of potentially harmful materials. There also appears to be a general trend of increasing vulnerability from the centre to the edges of the bog. Looking at this analysis, it would be recommended to focus restoration efforts in the contiguous vulnerable area to the south-west of the bog.
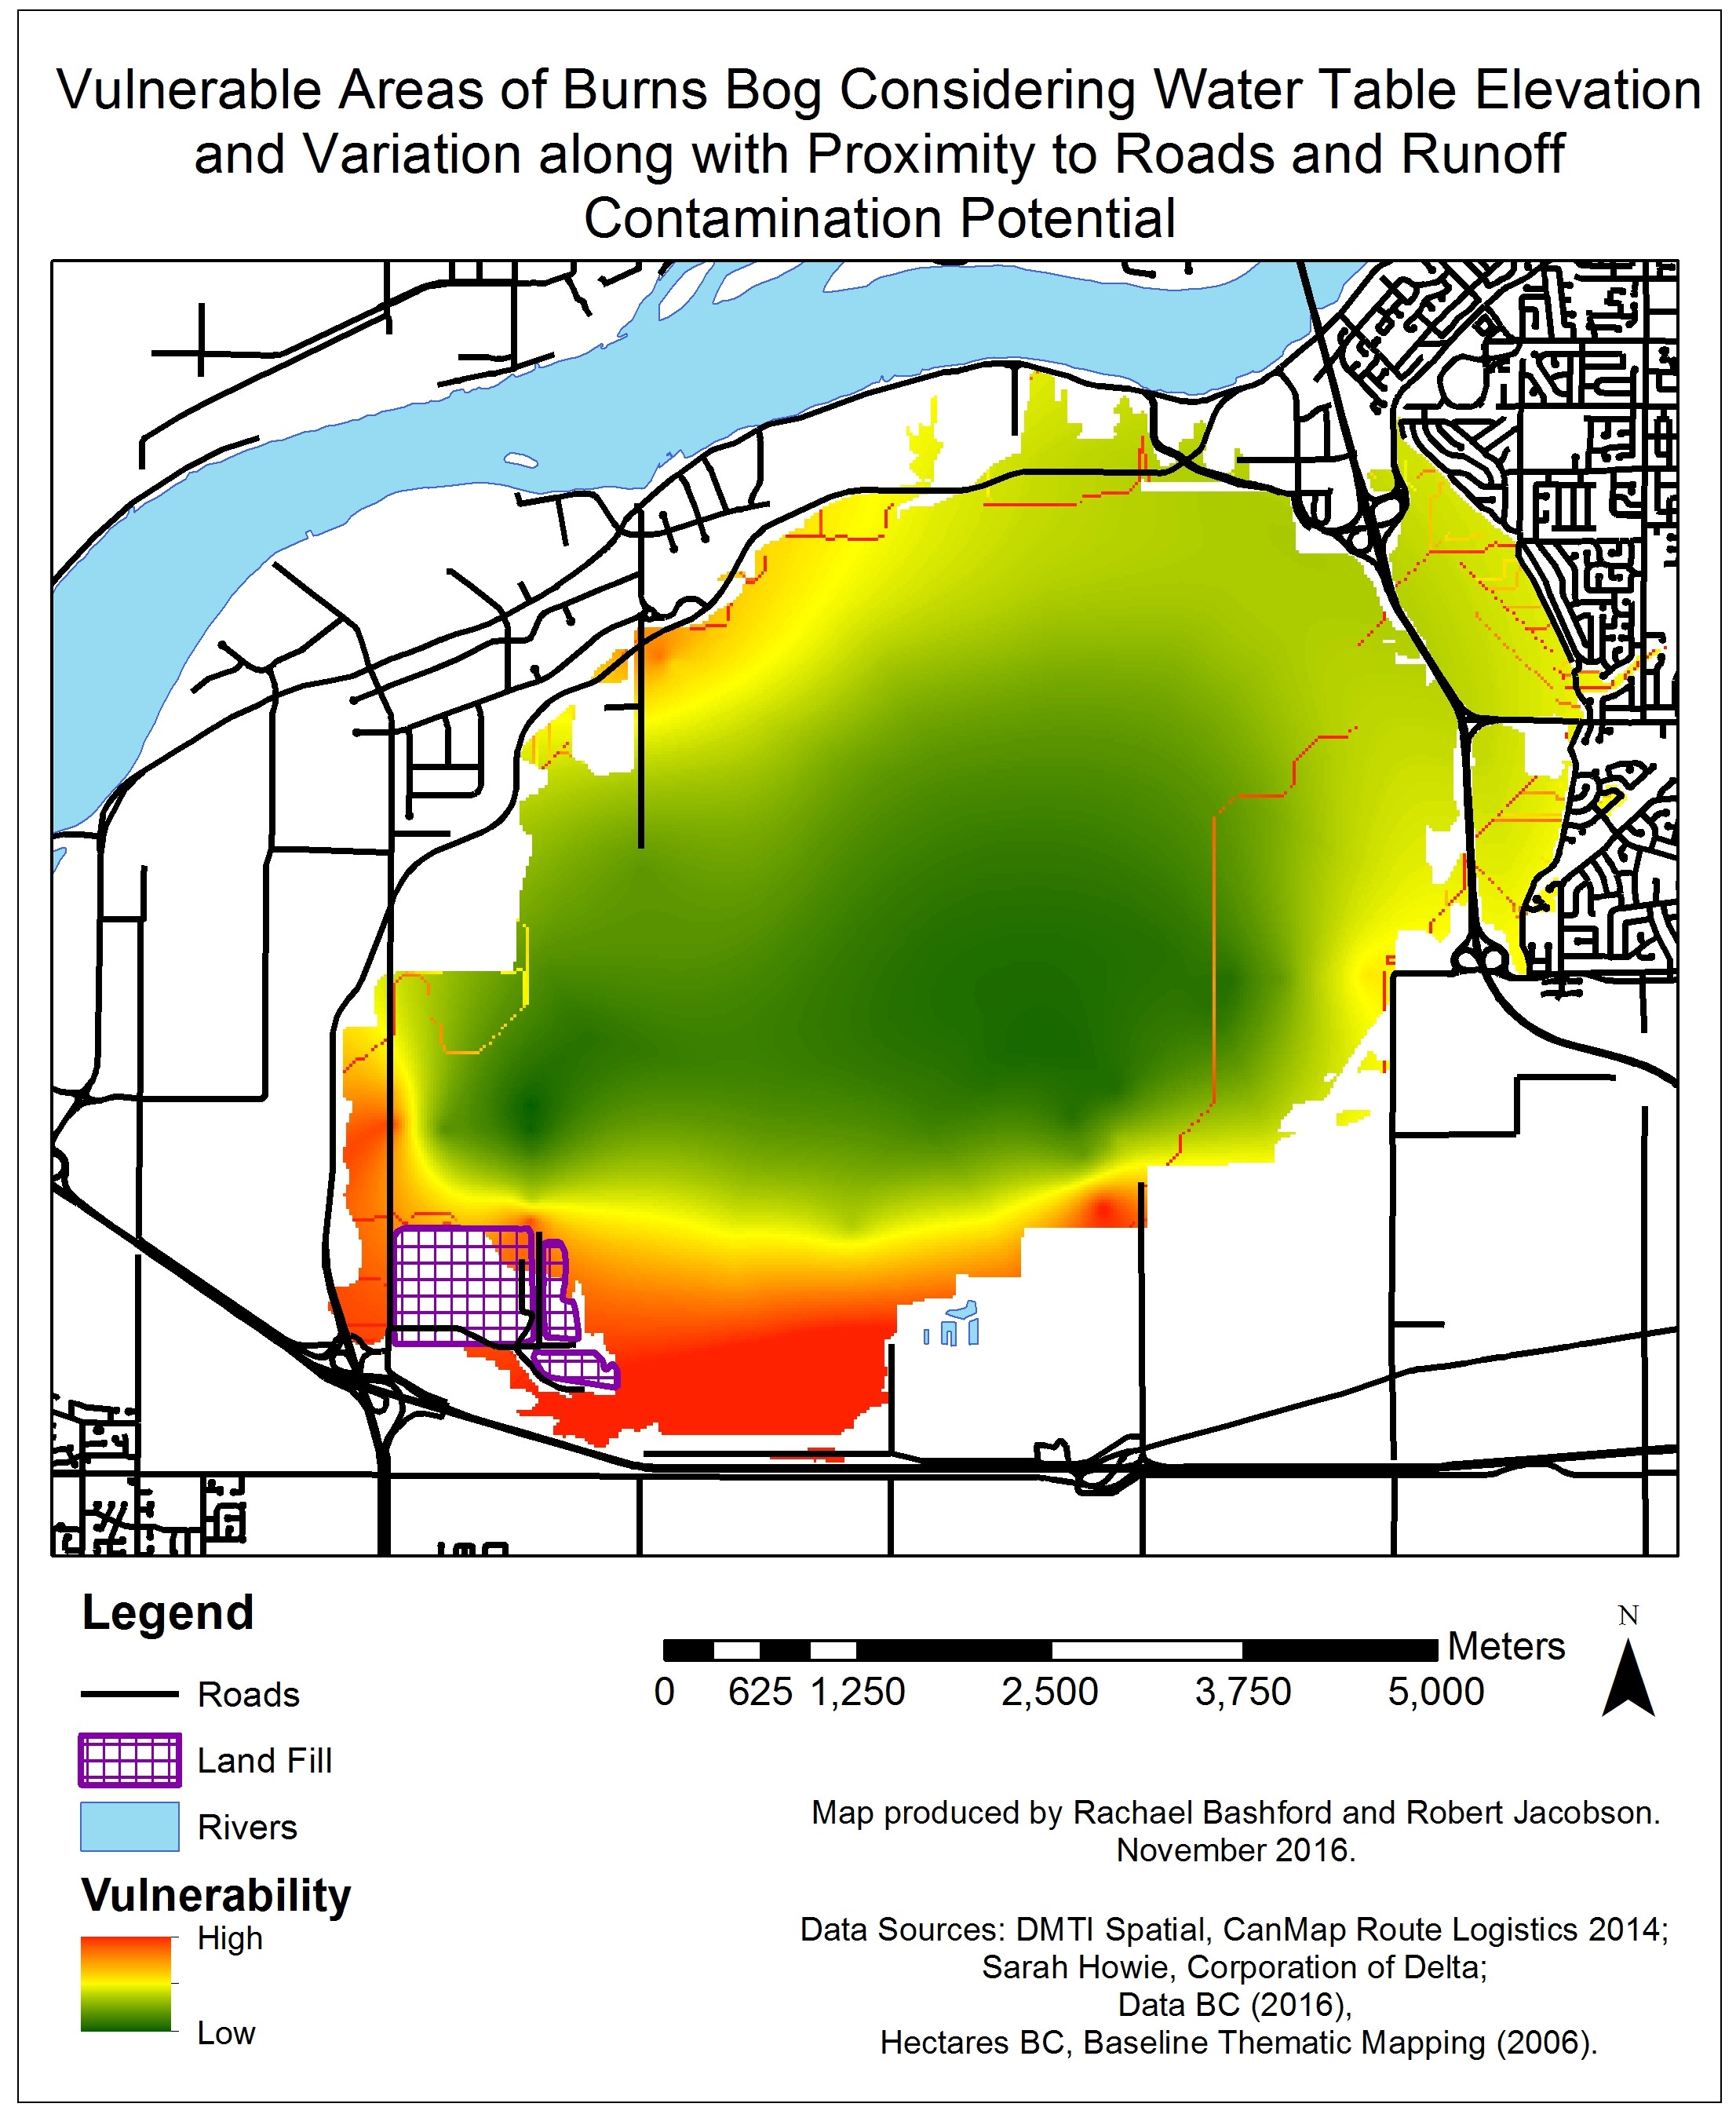
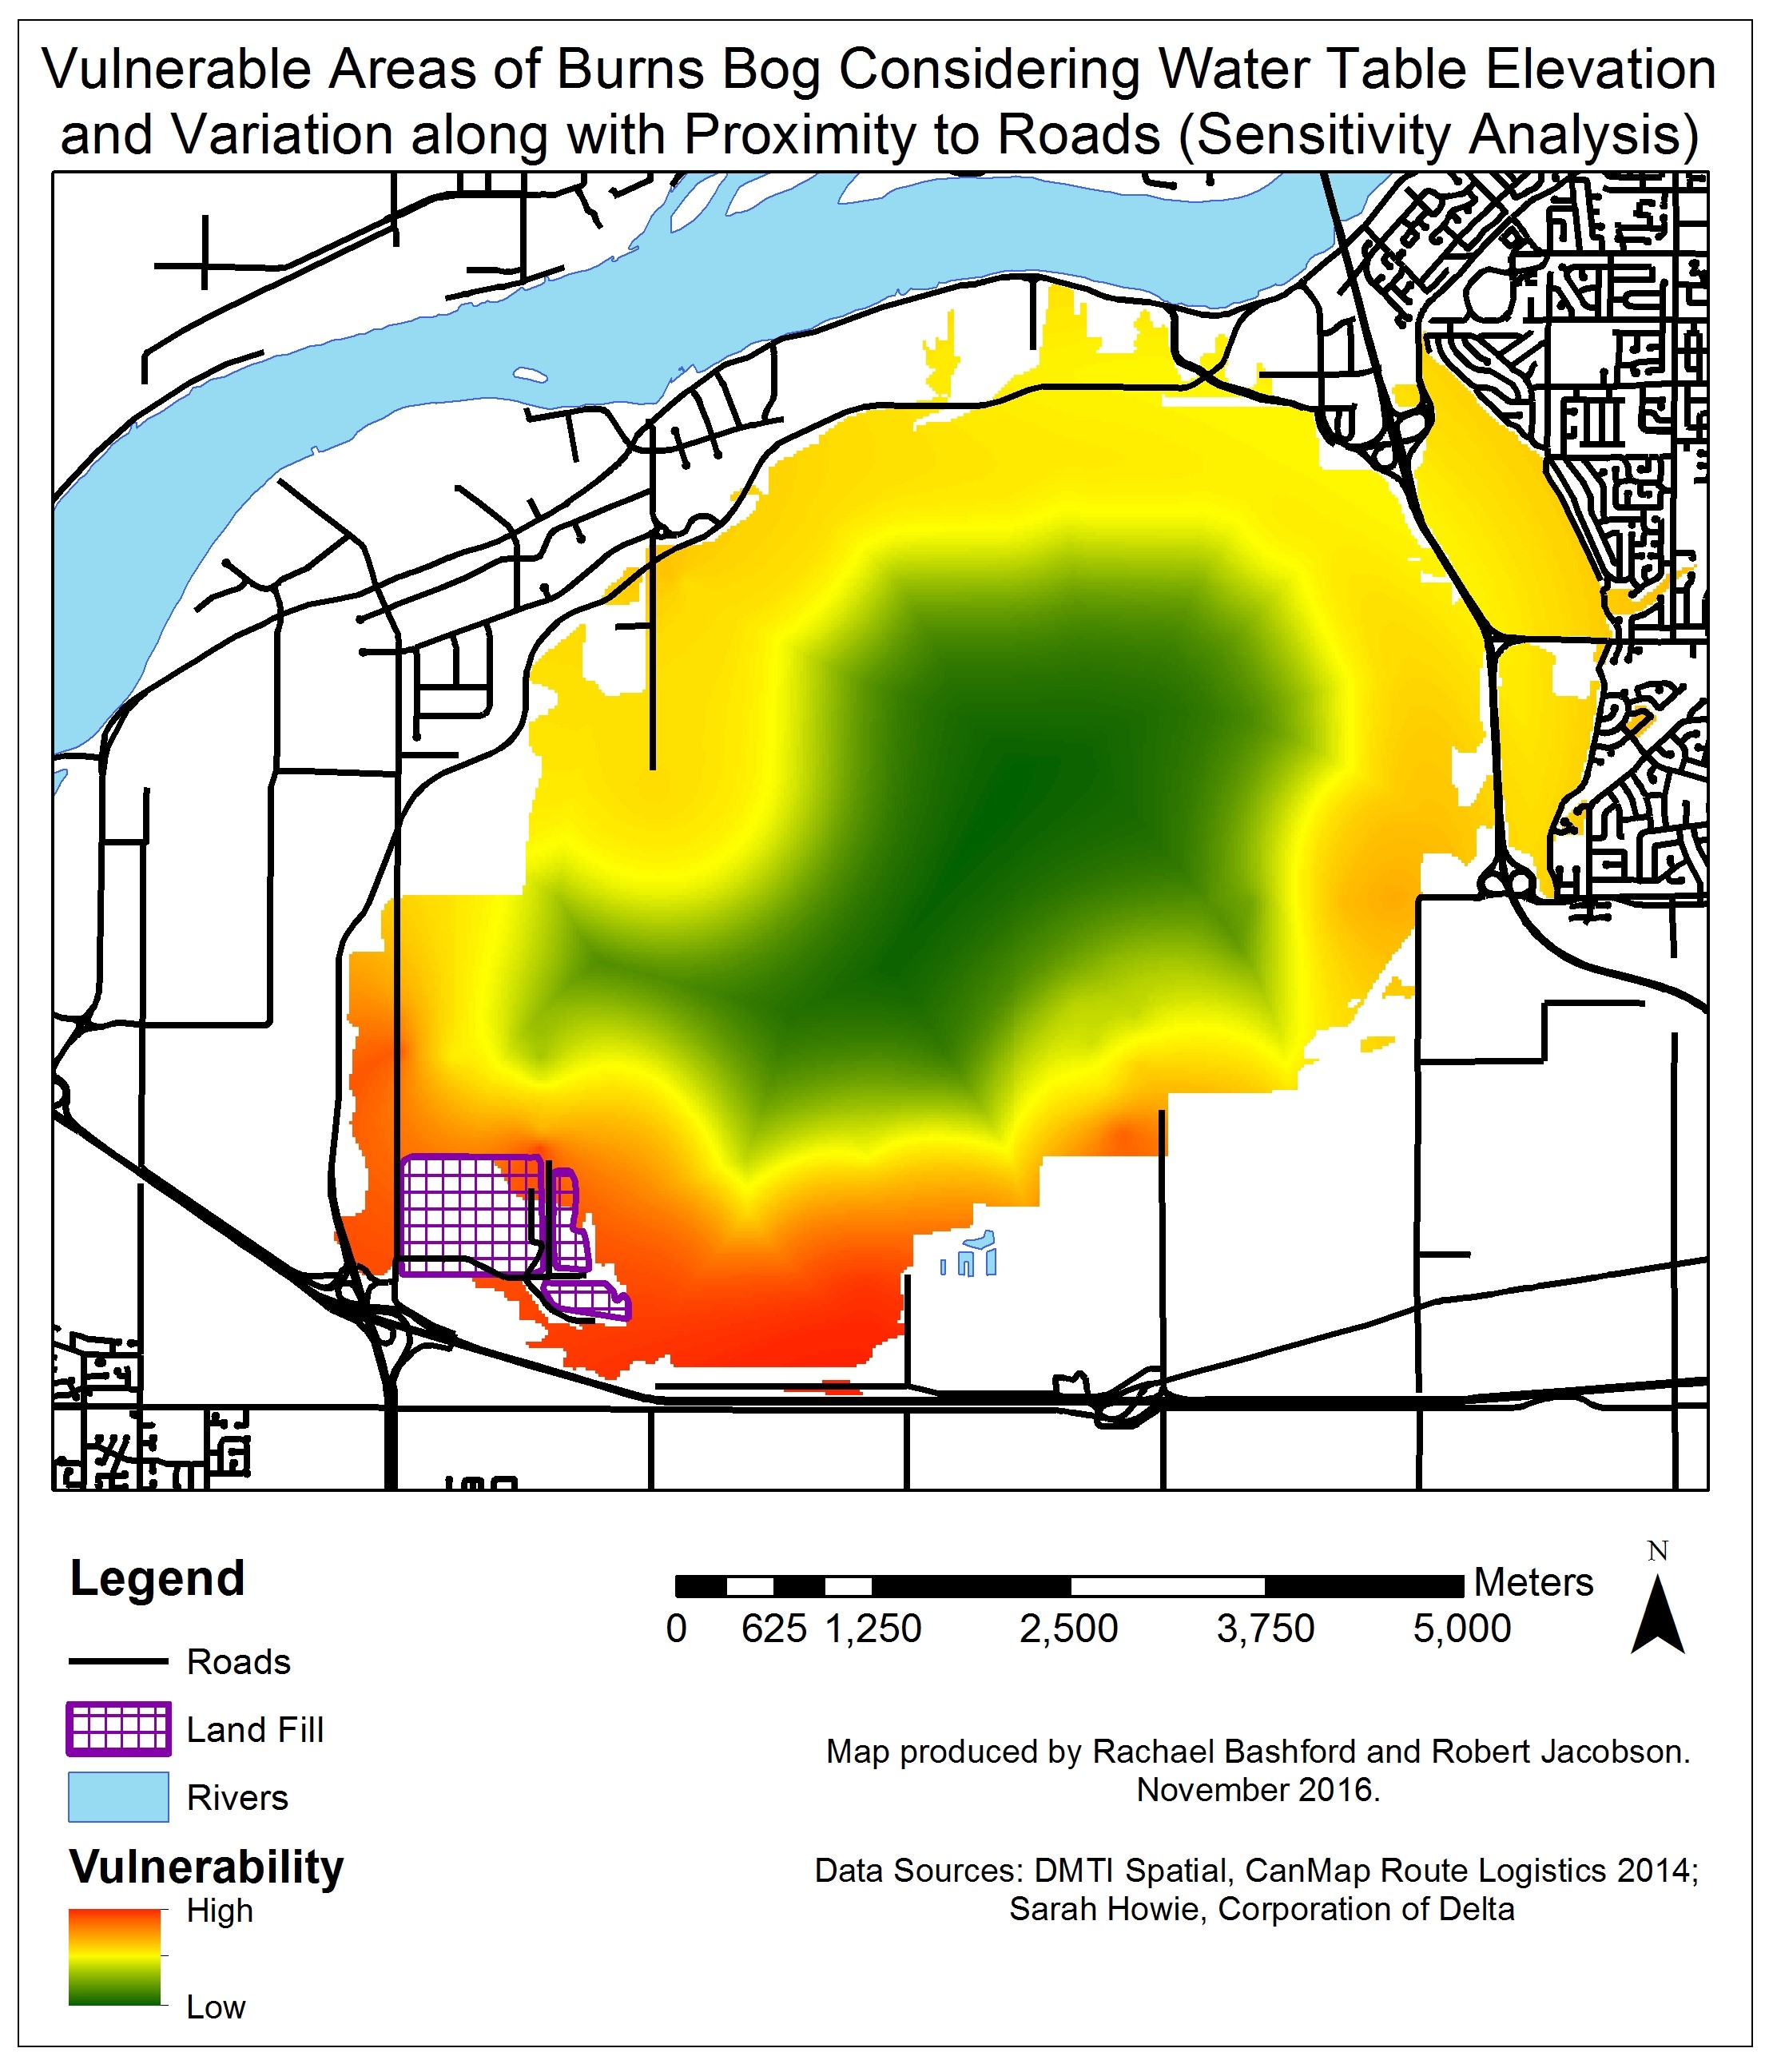
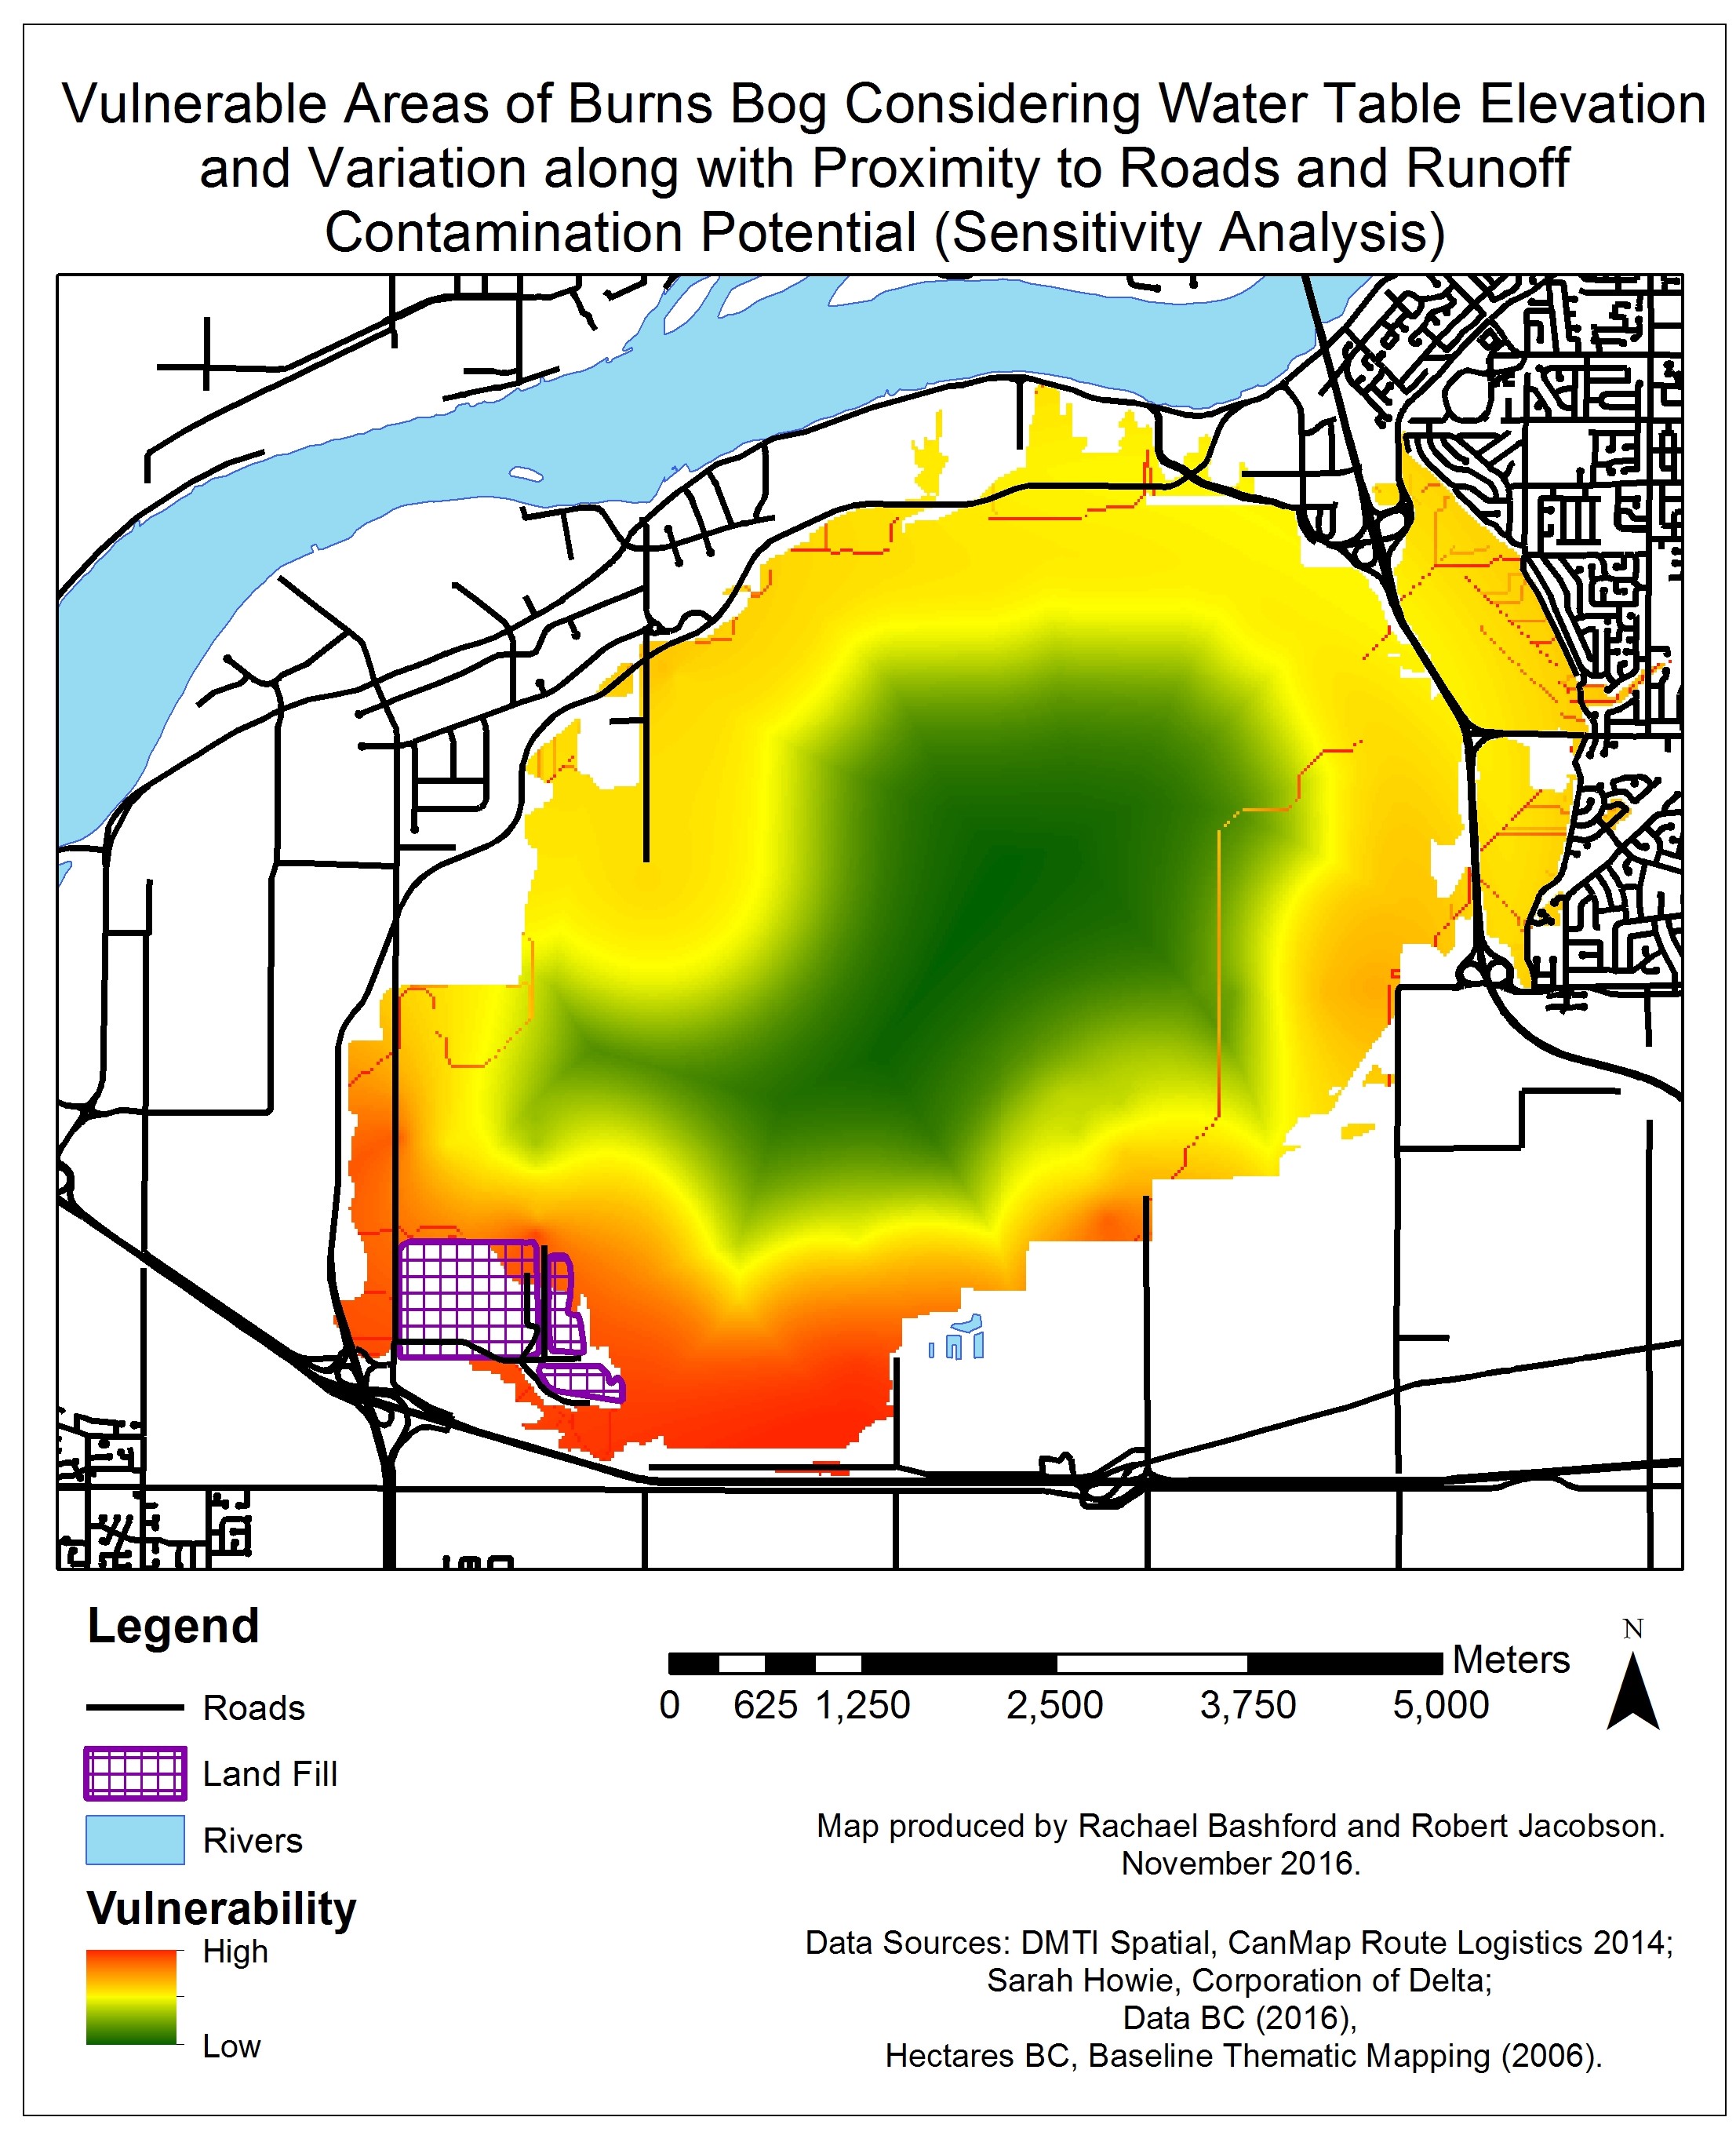
Figure 8, below, depicts our sensitivity analysis where we weighted all 4 criteria equally. Although this produces wider vulnerable areas around the edge of the bog, the most vulnerable area still appears to be the southwest portion of the bog, which agrees with our weighted analysis. The general trend of increasing vulnerability from the centre to the edges of the bog is also still apparent as are the vulnerable tracts of land following the runoff pathways.
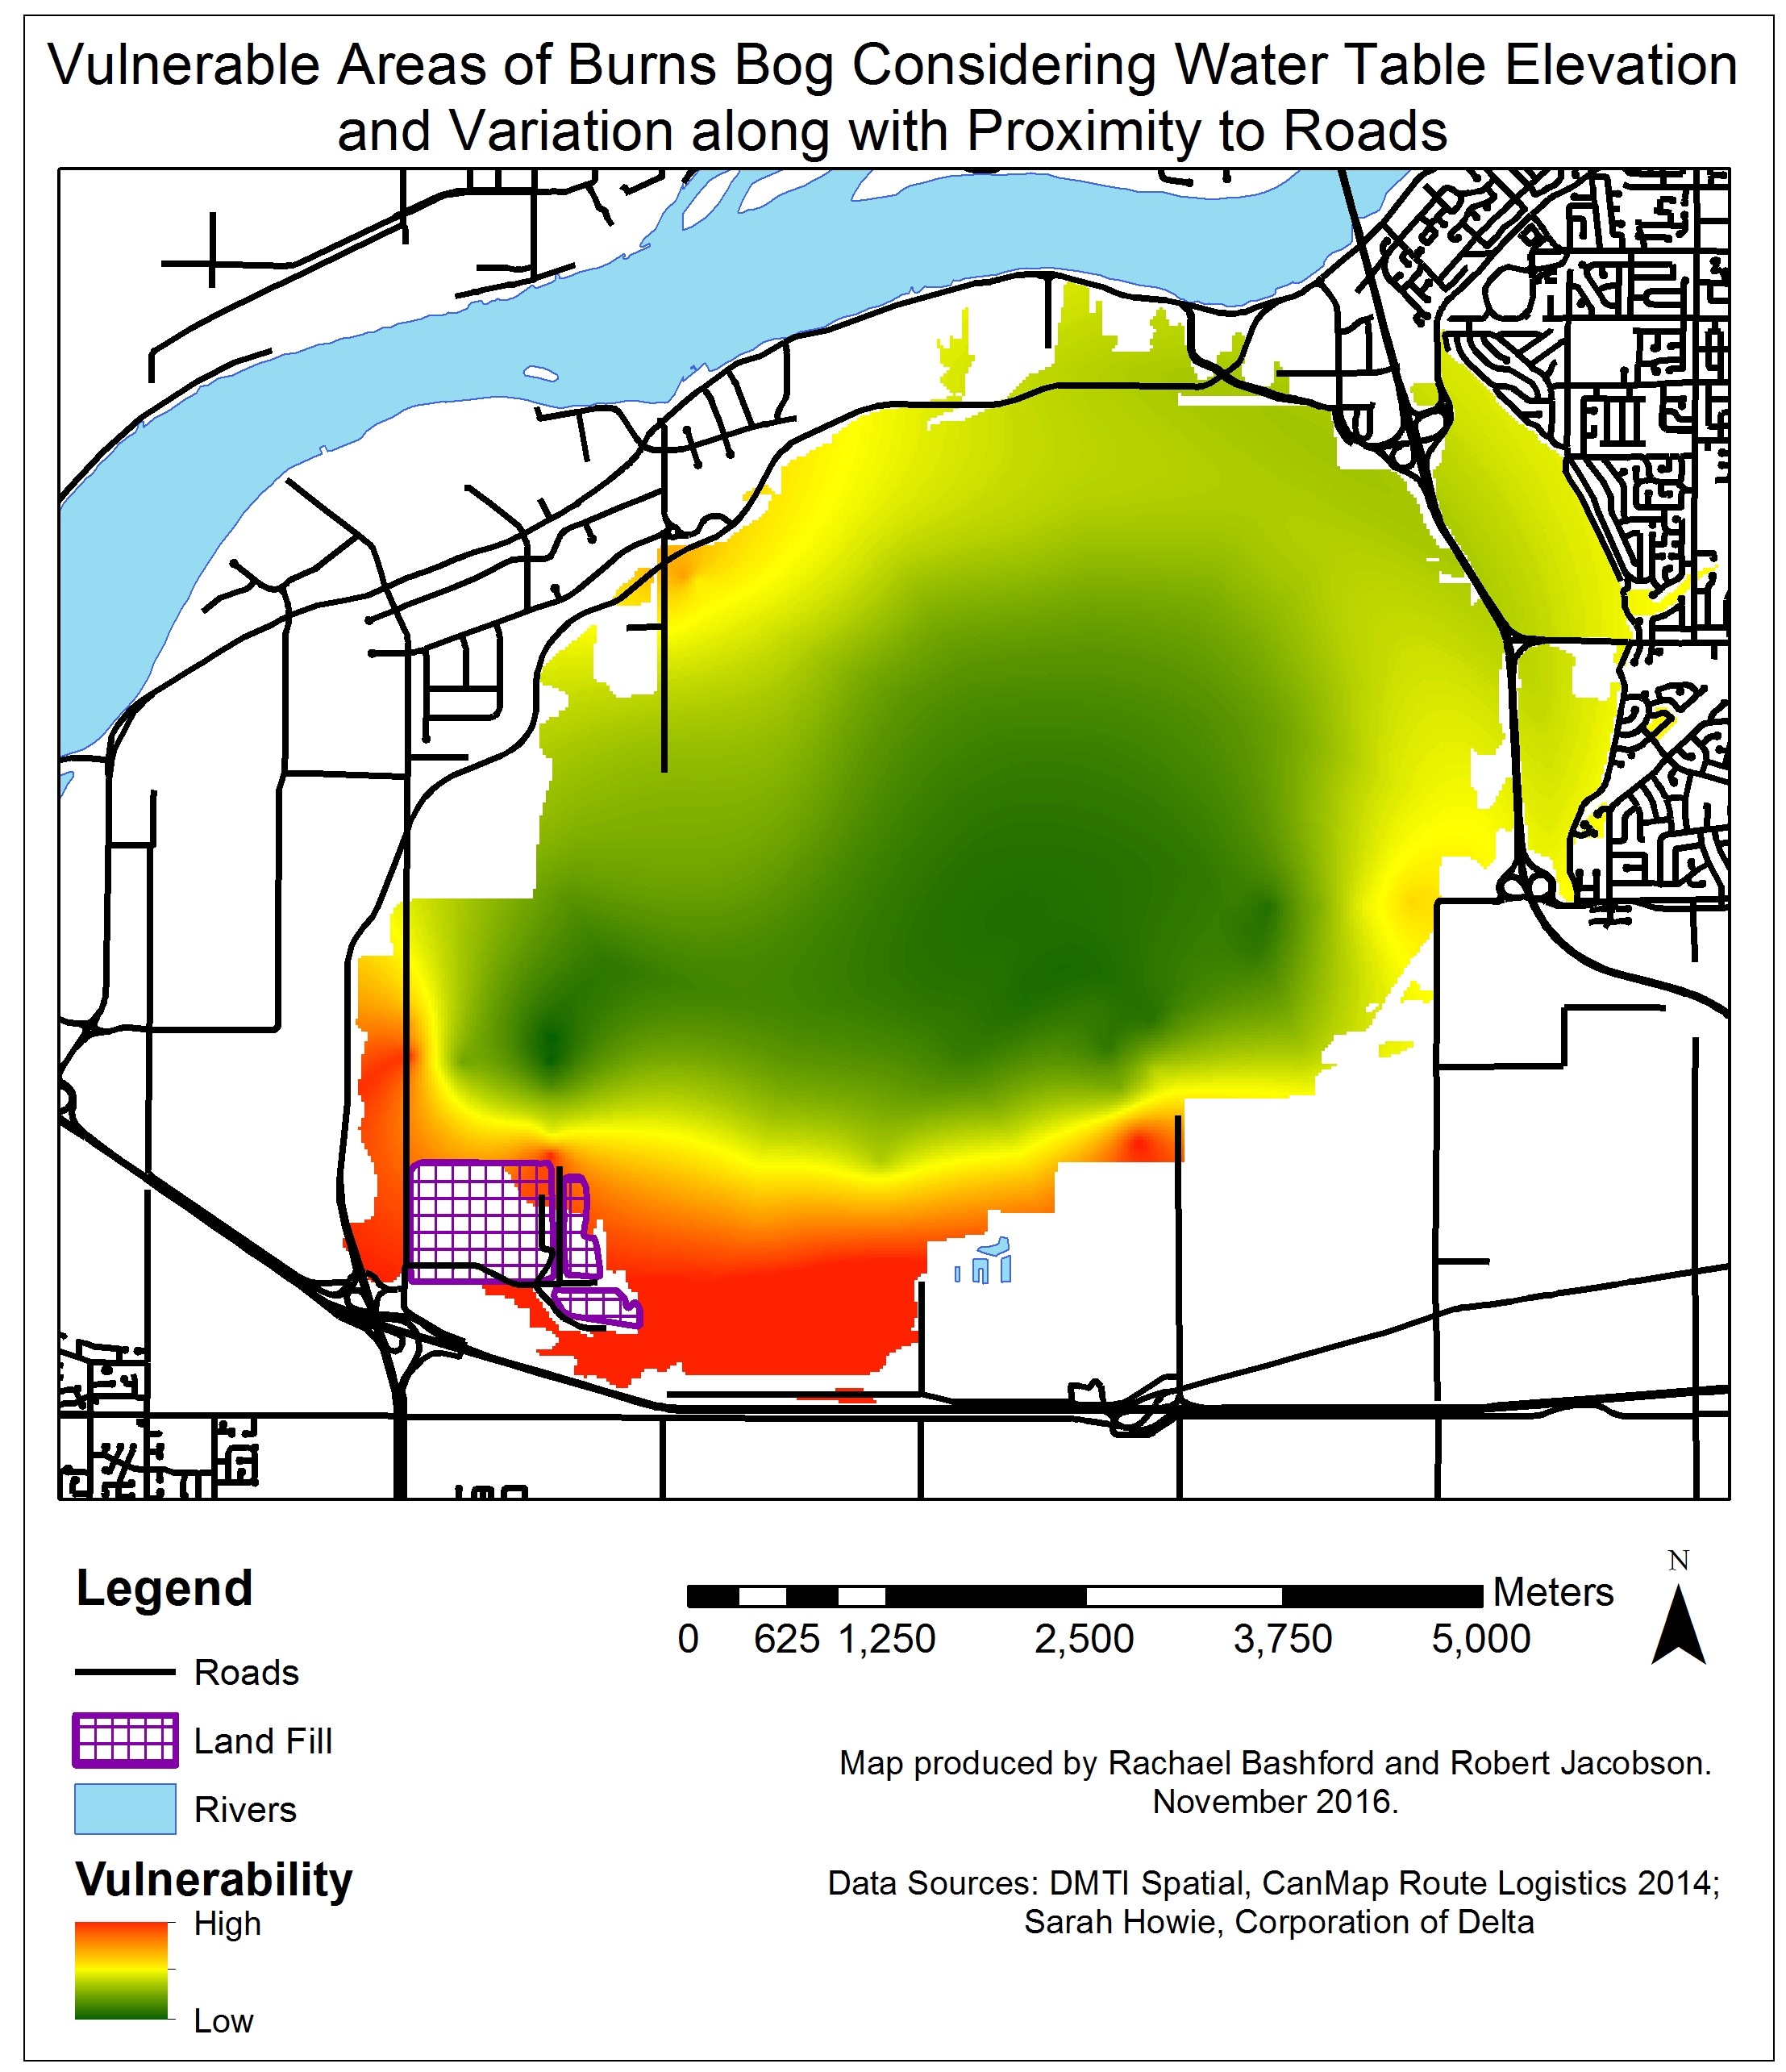
As the runoff pathways do not produce very large contiguous areas for efficient restoration efforts, we decided to run the MCE with only the other 3 criteria (water table elevation, water table seasonal variation and distance to roads). The output of this can be seen in Figure 9 with the sensitivity analysis in Figure 10. The weightings for the MCE in Figure 9 were recalculated using the calculator tool on the www.123ahp.com website. The output of this MCE is much the same as above, in Figure 7, with the most vulnerable areas located to the southwest of the bog. However this map gives a more continuous, cleaner looking map, showing the general trends of the bog’s vulnerability.