We received the water table elevation data in an excel file with one data sheet for each sample site from 2005-2016. We decided to average the water table elevation for the past 3 years (October 2013-September 2016) so that any anomalies would hopefully average out. Before averaging, the data was manually inspected and any missing data points were filled using interpolation to ensure that all sites had the same number of data points for each month and year. A new table was then created with the following columns; sample site/Northing/Easting/average water table elevation, for export into ArcMap.
- The excel document was then added to ArcMap as a point layer
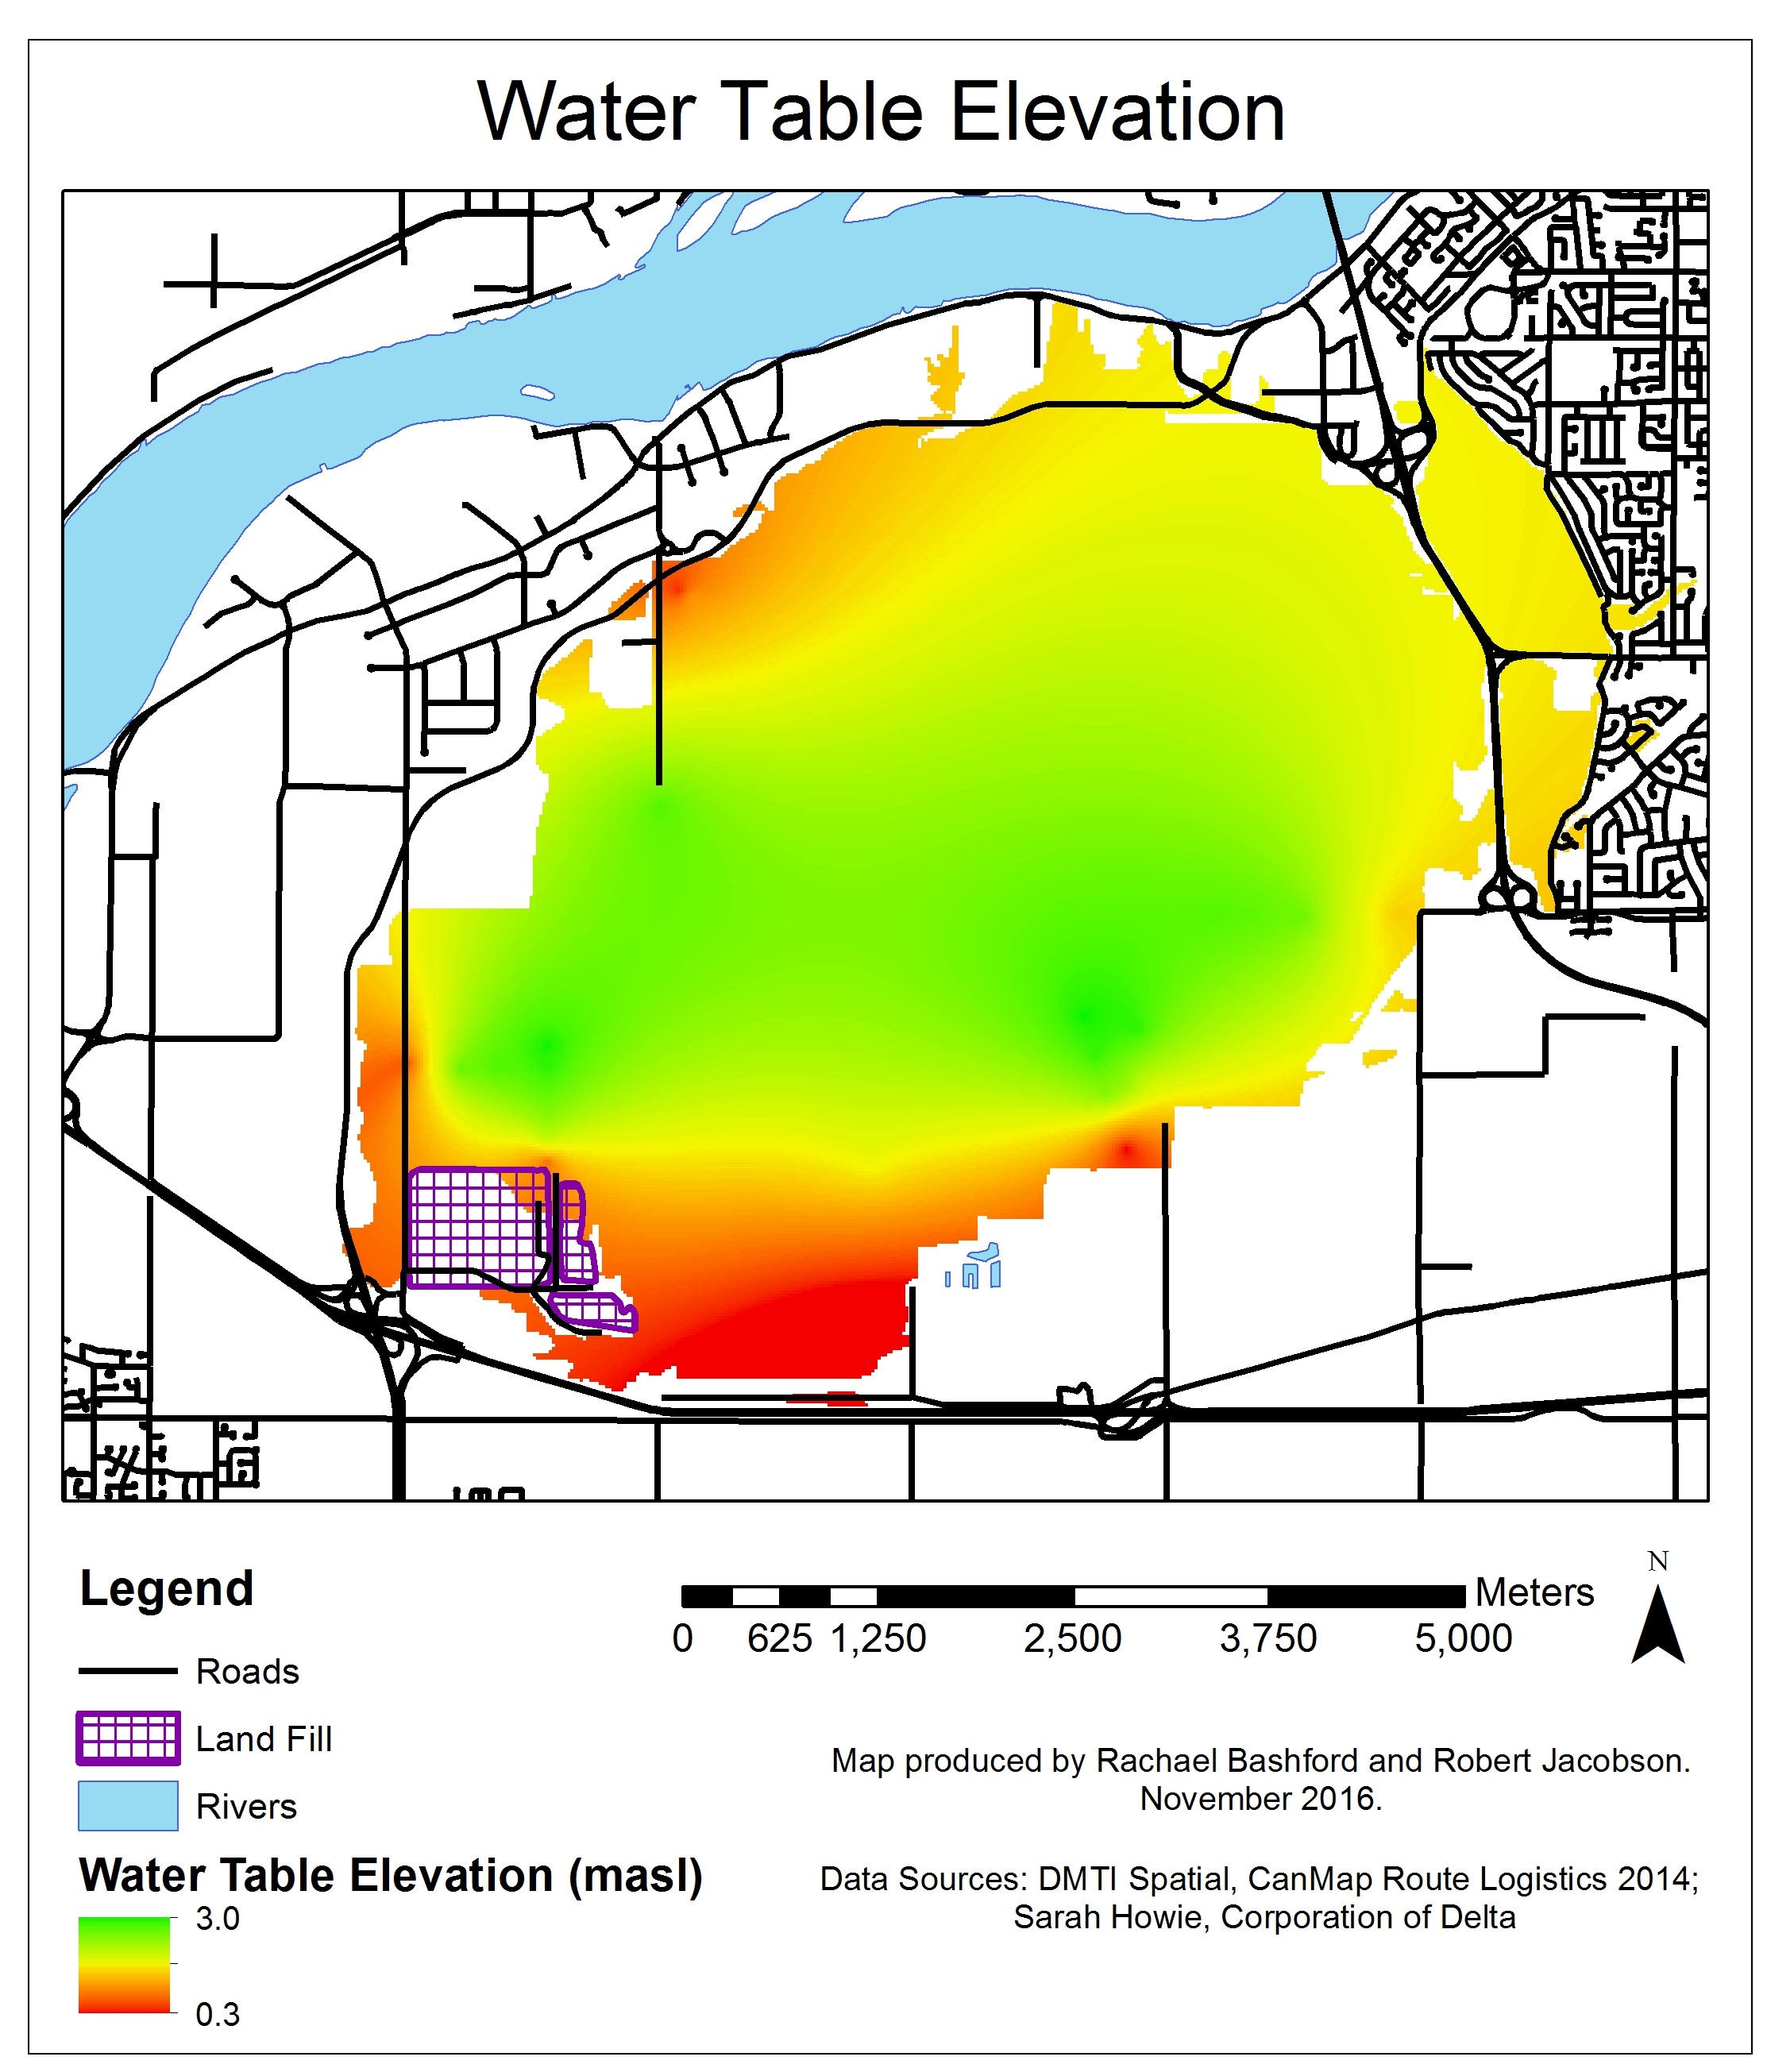
- The ‘Topo to Raster’ tool was used to convert the point data into a hyrdologically correct raster layer. This is displayed in figure 2.
- The ‘Fuzzy Membership’ tool was then used to normalize the raster layer so that the highest water table elevations were assigned a value of (0) which equates to the lowest vulnerability, and the lowest elevations were assigned a value of (1) which equates to highest vulnerability.

Figure 2.