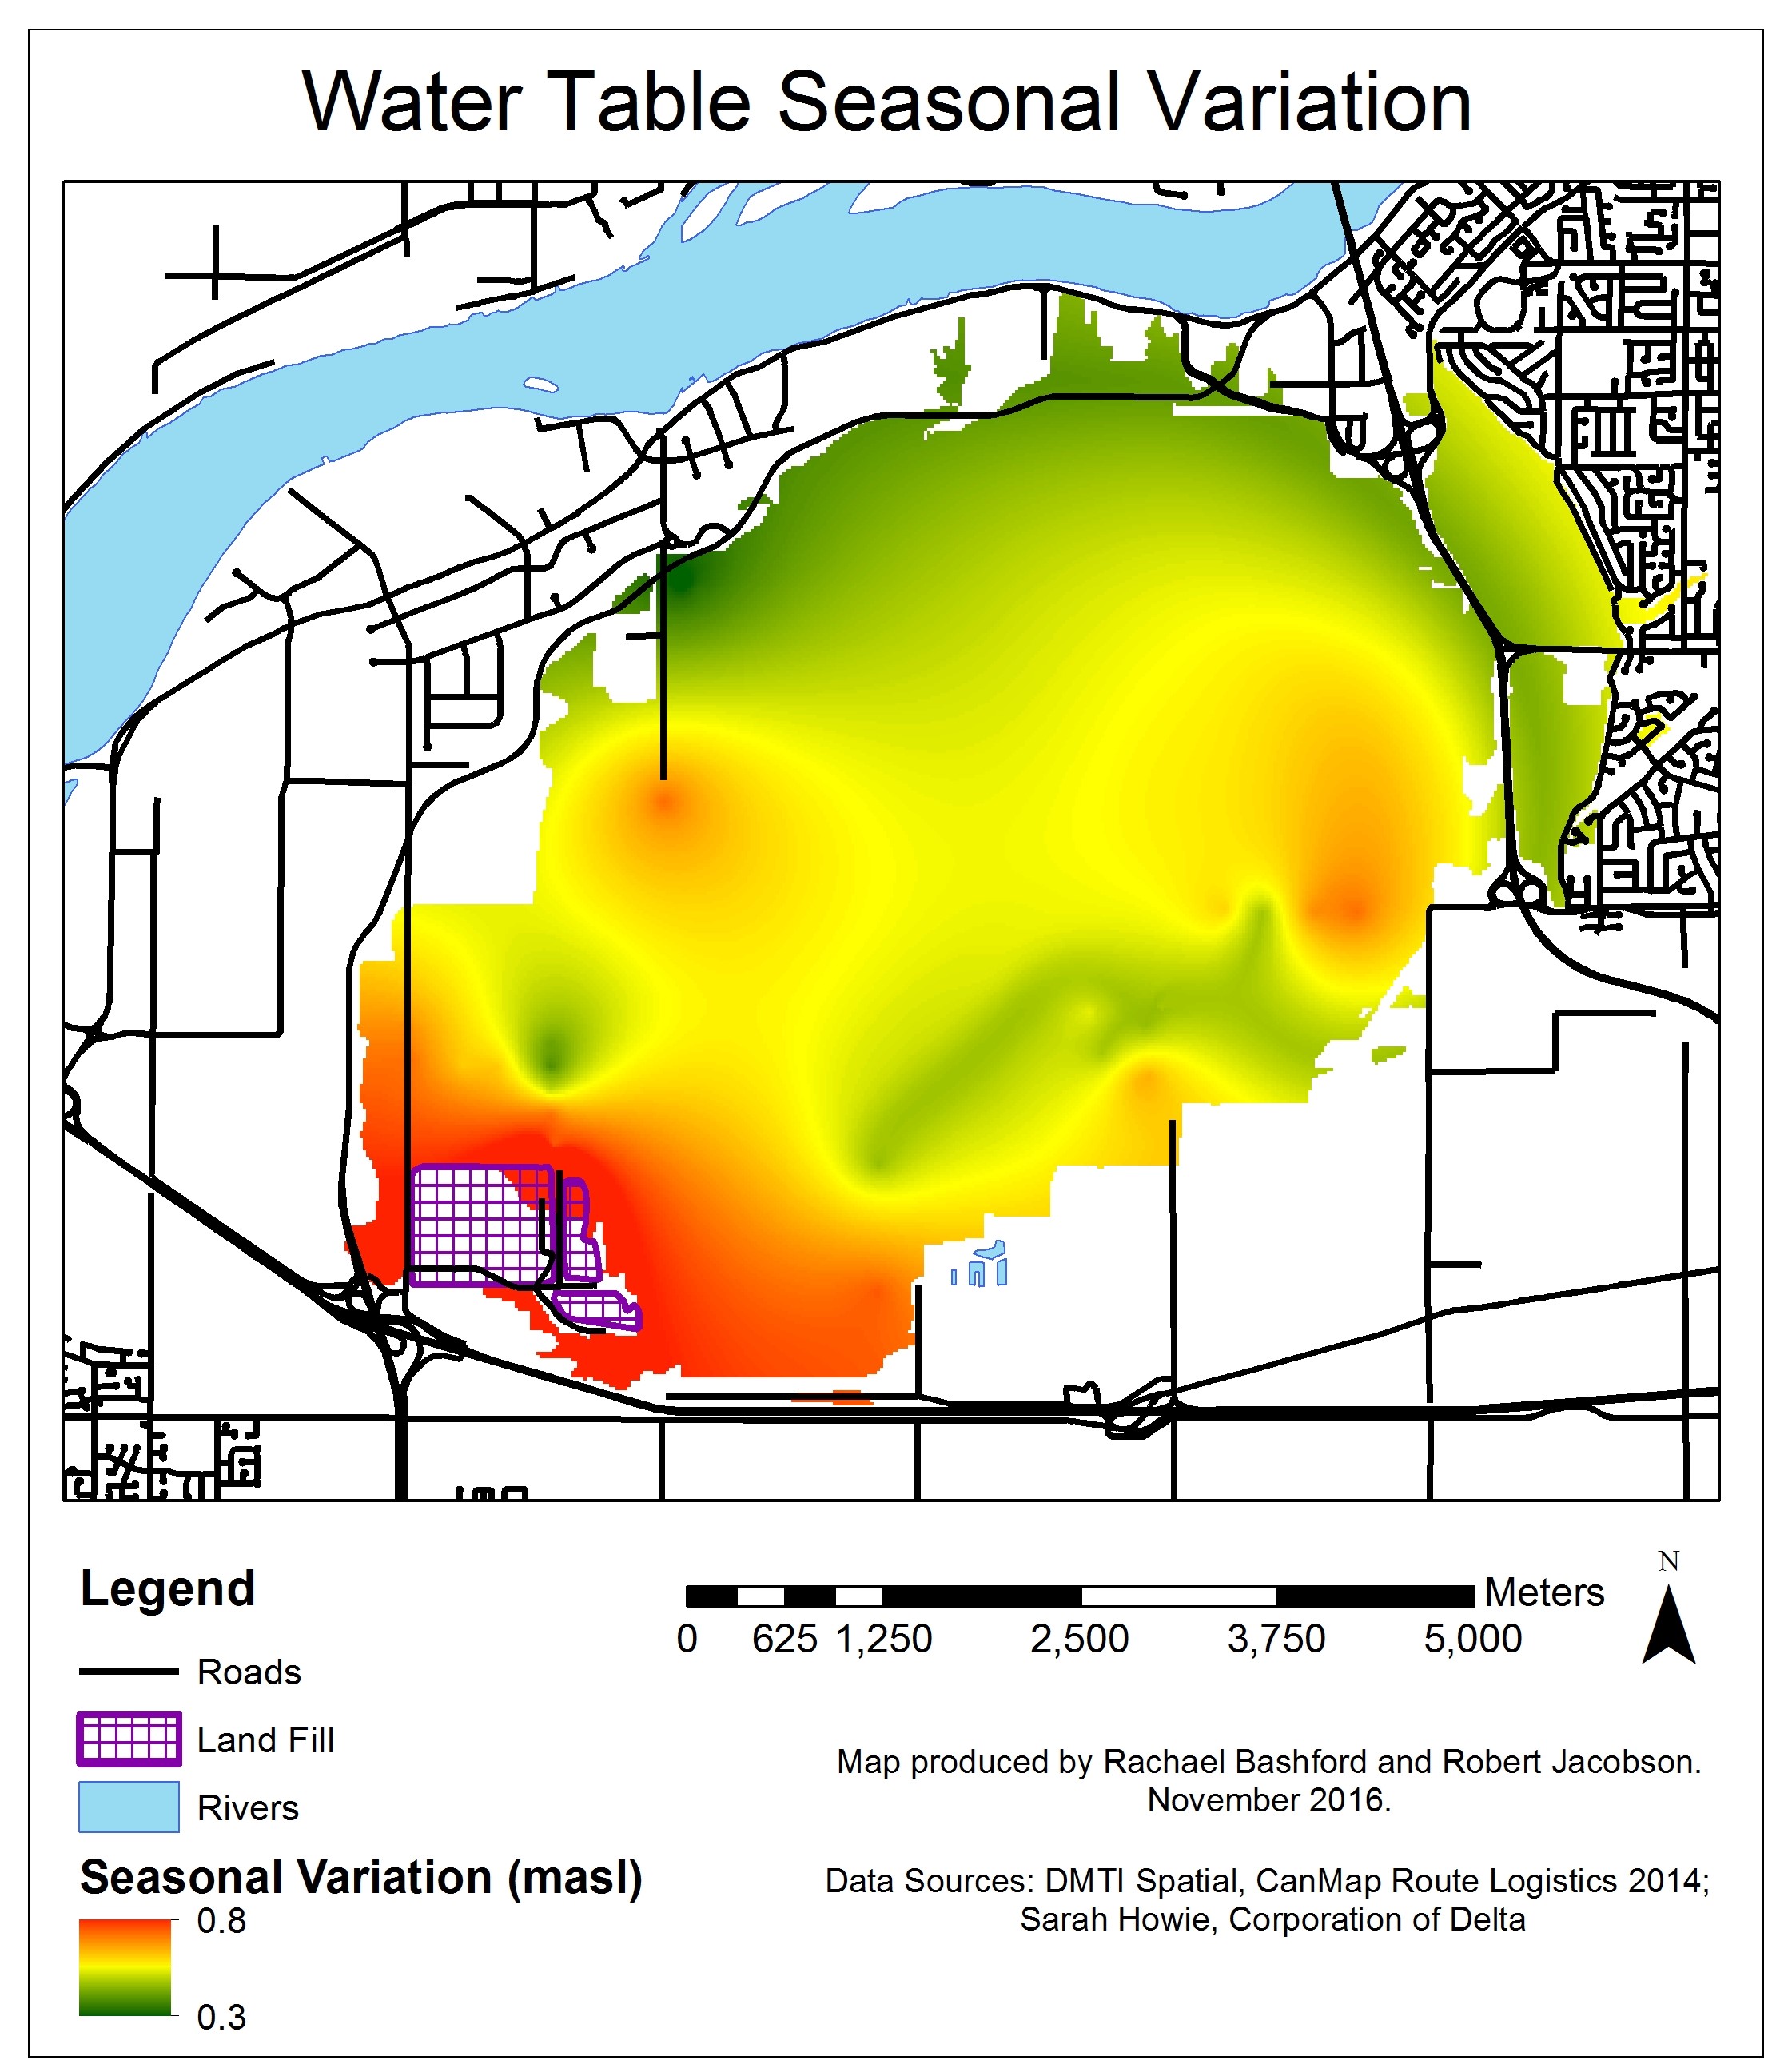
The seasonal variation layer displays the difference in the water table elevation of Burns Bog between summer and winter. This was found using the water table elevation data in the excel file from Sarah Howie; similar to the Water Table Elevation layer. The average summer water table elevation was calculated by averaging the water table elevation for August between the years 2014-2016 and the winter average was calculated in the same way for the month of February. The winter averages were higher across all sites than the summer averages so the difference between seasons was calculated by subtracting the summer average from the winter average for each site. This data was then added to ArcMap as a point layer and then converted to a raster layer and normalized using the same method as the Water Table Elevation Layer. The seasonal variation in water table elevation can be visualized in figure 3.