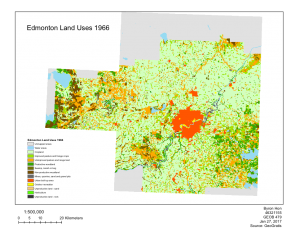
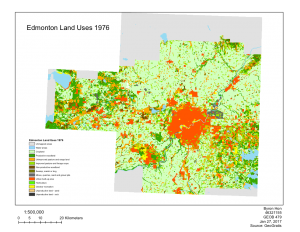
In this lab, land-use changes in Edmonton, Alberta between 1966-1976 was observed. We used FRAGSTATS to analyze the changes in land-use within Edmonton. The data used in this lab was obtained from the Canadian Land Use Monitoring Program (CLUMP), from Geogratis. There were multiple landscape metrics that were observed (Number of patches, Patch density, Shannon’s Diversity Index, Shannon’s Evenness Index, Landscape Division Index, and Total Edge) which were used to summarize overall trends of land-use change based on the whole study area. Followed by that, Class metrics (Class area, Percentage of landscape, Number of patches, Total edge, Total core area, and Largest patch index). The transition matrix showed exactly how each portion of land-use changed, and how the development of Edmonton was not only at the cost of cropland or improved pasture/forage crops, but other land uses such as mines, quarries, sand and gravel pits, and non-productive woodland. The comparison between the maps showed that there is an increase in urban built-up area, with urbanization appearing to radiate from the core from 1966 to 1976.
Categories


