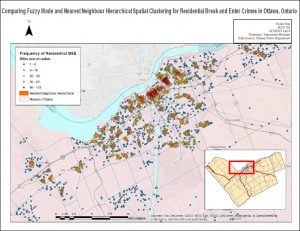
Within this Lab we used CrimeStat to evaluate the spread of break and entry crimes and auto thefts in Ottawa, Ontario. The data was obtained from the National Institute of Justice’s CrimeStat 4.02, and results were visualized using ESRI’s ArcMap as well as Microsoft Excel. Firstly, a statistical analysis was performed using CrimeStat to calculate the different kinds of indices related to distance through using the nearest neighbour clustering and Moran’s I correlograms. Moran’s I deals with the predictability of crime across various Dissemination Areas whereas Nearest Neighbour looks at spatial clustering between actual points. Despite small differences, both Moran’s I and Nearest Neighbour appears to show decreased correlation as positioned further from the chosen area.
In terms of identifying hotspots, Fuzzy Mode, Nearest Neighbour Hierarchical Spatial Clustering, and Kernel Density Estimates were used. Fuzzy mode produces frequency points by analyzing crime form its surroundings. One advantage of Fuzzy mode is that it can identify hotspots without creating exact areas/points by sampling nearby points. For Nearest Neighbour Hierarchical Spatial Clustering, this method is split between two other methods: Standard and Risk-adjusted Nearest Neighbour Hierarchical Spatial Clustering, which both creates ellipses representing clusters of crime. Kernel Density Estimates is split between two methods: Single surface and Double surface. Single Surface maps absolute crime volume whereas Double surface maps and normalizes crime rate. The Knox Index was then used to look at space-time clustering for car theft data. It examined whether the thefts were close or far in space and time. 
