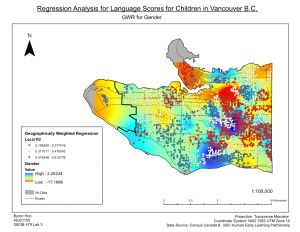
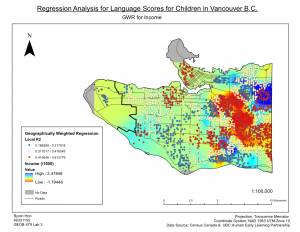
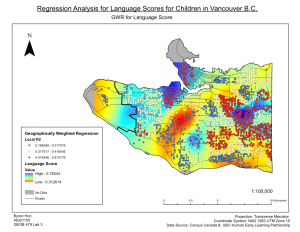
Within this lab, we assessed the factors that contribute to the social score outcomes of children, and how spatially consistent relationships between sociability scores and explanatory variables (family income, language skills, gender, and parental status) were across Vancouver using ArcMap. The data was obtained from Human Early Learning Partnership (HELP) at UBC, using Early Development Instrument (EDI) questionnaire. Moreover, census data (Enumeration Areas) was also used in the grouping analysis. An explanatory regression analysis was used to determine the set of variables that provides the best relations, with consideration of six explanatory variables(social score, percentage of neighbourhood families that are lone parents, percentage of neighbourhood immigrants that were recent immigrants, and percentage of neighbourhood that does not have French or English as their first language, % of the neighbourhood that belongs to a visible minority, and income). Three variables of the most significance were then determined: family income, language score, and gender. From this, an ordinary least squares analysis (OLS) was used to find a global model of sociability scores which was compared to the results produced by the Geographic Weighted Regression (GWR) tool. Grouping clusters were then determined using the Grouping Analysis tool to relate the results from OLS and GWR to other variables used to create the groups. I found that only two of the three variables are statistically significant from OLS, and the map of OLS residuals showed no significant spatial patterns. As for the GWR results, the surface map of social score showed good correlation with GWR R2 values, so it would seem that social scores and language scores have the strongest relation.
Categories


