Categories
GEOB 479 Lectures

February 5-8: Health Geography and GIS

Health Geography is the application of geographical information, perspectives and methods in the study of health, disease and health care. There are 5 core ideas within Health Geography: spatial patterning of disease and health, service provision, humanistic approaches to medical geography, structuralist and materialist approaches to medical geography, and cultural approaches to medical geography. In the past, ‘medical geography’ was prominent in the geographical study of health, disease, and health care. However, now with contemporary approaches: Humanistic, structuralist , and cultural geographies of health, it is viewed more holistically with a variety of cultural systems and biospheres taken into account as well. Humanistic approaches to medical geography typically look at understanding lay rationality. Structuralist and materialist approaches looks at the inequalities in health, through the perspective of Marxist critiques of capitalism. It assumes that the structure of social, political and economic systems are the key determinant of health and variations in health. Cultural approaches consider the field by looking and therapeutic landscapes and health promotion, assuming that it is important to reframe health in positive terms, with place being an important determinant of health.

There are also 3 main themes in health geography: disease ecology, health care delivery, and environments & health. Disease ecology deals with the interactions between viruses or bacterias versus human/non-human hosts. Health care delivery is involved with the distribution of health services with respect to human settlement as well as social inequalities in access to health services. Environment and health focuses on the environment’s contribution to people’s health and well-being.

Categories
GEOB 479 Lectures

January 25 – 27: Statistics (Review)

Statistics is important as it allows for different analyses to occur within the field of GIS as it explores, summarizes and illustrates relationships that may exist within datasets. One of the forms of regressions that was touched upon was Ordinary Least Squares. Ordinary Least Squares (OLS) is a simple regression model which assumes a linear relationship between the dependent variable(s) and the independent variable(s). OLS estimates what impact unknown parameters have an attempts to minimize the differences between observed and predicted results. Ordinary Least squares regression applies the same formula to an entire study space. If the relationship between the degree of influence the independent variables influence the dependant variable, then the regression equation will not accurately estimate the relationship in all areas.

However, this gap in research tools is what required the creation of GWR analysis. The general idea behind GWR is that relationships between variables are subject to spatial non-stationarity, meaning that the relationship is not constant over space. A model exploring these relationships must alter over space to reflect the spatial variation in the structure of the data. A regression equation is formed for each point at those surrounding it, creating a subset of data for each point that weights the importance of those closest to the centre. Understanding spatial variations in relationships between dependent and independent variables within a space is critical to many different types of studies, making it a very useful and adaptable model. Many scholars utilize both OLS and GWR to compare utility of both models. When performing regression analyses in the future, I will always consider using both to investigate the spatial stationarity of the relationships I’m examining- geography always has an impact!

Categories
GEOB 479 Lectures

January 18 – 20: Understanding landscape metrics

This week, landscape ecology and the application of GIS within the field was explored. Landscape ecology can be defined as a field that explores the importance of spatial patterning on the dynamics of interacting ecosystems. We learned with landscape ecology the landscape is the most important unit of study, where an area is spatially heterogeneous in at least one factor of interest, and is the scale at which management decisions and human effects are most commonly considered. Landscape ecology also has a fundamental assumption that the location of things can have important consequences on the surrounding environment. If spatial autocorrelation is shown by objects or events, patterns can develop from a response to an environmental factor (first-order process) or interactions between objects themselves (second-order process). Stationarity and scale are also important to landscape analysis as it measures how well patterns stay the same over space.

Categories
GEOB 479 Lectures

January 11 – 14: Why is ‘Geography’ important?

Within this week, the overall impact geography can have on data was touched upon. Geography is crucial because the geography of a problem must be considered to produce an effective analysis and many geographical elements of a study such as scale, boundaries and spatial dependence can impact results produced. In regards to landscape ecology, there isn’t a “natural” scale at which ecological studies should be undertaken. While most ecological phenomena have a spatial temporal domain, the definition most appropriate scale must be considered carefully. The Modifiable Areal Unit problem (MAUP) was again reviewed, which describes how scale or boundaries impact the data being collected.

MAUP must be considered in all GIS analyses to evaluate potential sources of error and uncertainty. One concept which highlights the impact geography can have on an analysis or social data collection is Gerrymandering, which refers to the practice of manipulating electoral district boundaries in order to create zones where a particular party would have a political advantage. The Simpson’s paradox was also explained as a confounding variable that is not taken into consideration in the analysis as some variables vary in correlation with another (e.g. high unemployment and other socio-economic characteristics) making it difficult to obtain a reliable estimate of true correlation between two variables.


Categories
GEOB 479 Lectures

Introduction week: January 4-6

Within our first week of GEOG 479, we went over the general structure of the course and the topics we will be covering in the future. We will be exploring three broad topics-landscape ecology, health and crime, finding geographic commonalities in their spatial analysis. Learning to see geography as a common factor in the analysis of subjects that at first seem too distant to be related seems to be the takeaway point of GIScience.

FRAGSTATS was also introduced this week. Fragstats is a software program that computes landscape metrics for categorical map designs. We will be using it in our first lab to see how patterns and interactions of a landscape changes over time. Fragstats is a useful program for the study of landscape patterns and mosaic. A program that is able to do such an analysis is critical because landscapes do not exist in isolation. They exist within context regardless of the scale defined, housed in a larger landscape within larger landscapes. While keeping patterns, processes, places, people and perspectives in mind, we will analyze landscapes and changes to them in next week’s lab using the background skills we went over this week.

Categories
Graphic Design

Designing a Restaurant Logo

A redesign of a Vancouver Chinese Vegetarian staple.

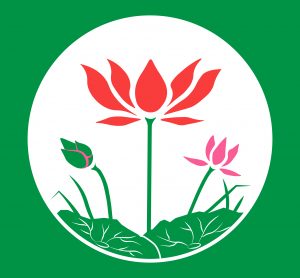
Sun Bo Kong Vegetarian Restaurant wishes to display Buddhist influences and the importance of the lotus plant within its logo. Each colour and iteration of the lotus provides multiple unique meanings in the context of Buddhism. The red lotus signifies emotional attachments to the heart (love, compassion) and is usually depicted with its petals open to represent the heart being open and filled with love. As a representation of the Buddha himself, the pink lotus represents the history and legends of the Buddha. The un-opened lotus bud represents mysticism and spirituality. As a whole lotus flowers rise from the depths of a muddy river, blooms and thrives. This symbolizes the human who rises from the darkness of the world into a new way of thinking and living. Taking all these meanings into consideration, the following logo was designed.logo

Categories
Uncategorized

A Glimpse of Travel History

Check out some snapshots of my travels here:
https://www.instagram.com/byron_getonefree/
Categories
Uncategorized

Environmental Design Portfolio – 2016

To check out a few of my designs and drawings from 2016, Click the link below:
ENDS portfolio interactive 
Categories
Geographic Information Systems Projects Projects

Personal Development Reflection

Upon the completion of GEOB 270 (Introduction to Geographic Information Science), I have developed various transferable skills of utilizing the ArcMap and ArcCatalog programs in analysis of real-world geospatial problems and situations. Each of the  labs consecutively provided a deeper insight and understanding of the software, which also progressively raised the difficulty of labs. However, this allowed me to explore GIS out of my comfort zone as well as gain the perseverance to fulfill all the requirements of each lab to my potential. All in all, these valuable new skills I have obtained will inevitably be a detrimental addition to my skill-set as they are very practical and desirable in many occupations.

Categories
Geographic Information Systems Projects Projects

Final Project: Nanaimo ALR Analysis

  1. Summarize the project:  your team’s project goal?

The project goal was to assess the land use of the Agricultural Land Reserve (ALR) provided by the British Colombia provincial government and whether the reserve is appropriately used with the Nanaimo area. In specific, the ALR is a policy that protects agricultural land to strengthen provincial food security. Upon implementation, the ALR was seen as progressive legislation that prioritized food production for future food security. In recent years, there have been increasing threats to the ALR from urbanization and land development.

2. How did you organize your team (project management)?

In terms of project management, my team worked as a whole in the retrieval of data for our project. Afterwards, we divided the analysis of the project area by Biogeographical analysis and Social analysis, which two people worked as a team for each section. For communication and sharing of files, we utilized Google Drive, which was very efficient.

3.What were some of your most valuable contributions (as an individual) to the group? And are there people you should thank for really standout work on your team?

I think that one of my most valuable contributions to the group was my interest in GIS analysis and the overall ArcMap program. I genuinely interested in assessing geospatial properties and using that in relation to real life problems/situations. This interest motivated me to be proactive with other members who were at times struggling with using ArcMap and finding solutions to use ArcMap functions to its potential for our project area. I contributed by performing a lot of the analysis and aided my group members when they had questions with how to use ArcMap.

4. What are some interesting things you learned as a result of the process?

Of the many interesting things I’ve encountered in this project, the one that stands out the most is finding the slopes of the project area and isolating the layer with a slope that is greater than 30 degrees (which is too high for agricultural production). Through this obstacle, I’ve cemented what I’ve learned before in labs in the operation of DEM’s (Reclassify, Clip, Raster to Polygon) as well as new skills/tools such as using the Slope tool and Mosaic to Raster tool. Since, our project area fell between two UTM zones of 92G and 92F, many of our files had to be merged together and then clipped to our project area. When combining DEM’s, the Merge tool would not suffice, so I’ve learned to use the Mosaic to Raster tool, which is incredibly useful for future reference. I’ve also learned the importance of organization when downloading data and how to properly manage a geodatabase which was crucial in the production of a neat and tidy map. This helped my group compile all of our maps to create our final shapefile.

Spam prevention powered by Akismet