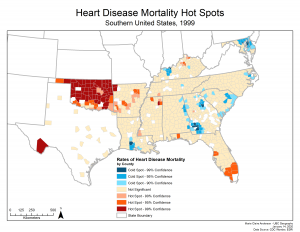
In this tutorial we obtained health data from the CDC, and used ModelBuilder within ArcMap to create two models to help us pinpoint the hot spots of heart disease mortalities in the southern U.S. for the years 1999 through 2016. We used the Generate Spatial Weights Matrix tool to quantify the spatial relationships within the dataset, the yield of this tool is necessary as it is further used in the Hot Spot Analysis tool. The first model created split the data into yearly feature classes, and the second model ran the hot spot analysis for each of the created yearly feature classes.
Using the output from the hot spot analysis we were able to use the group layer animation function to sequentially display the hot spot results over time. In doing so spatial patterns became more visible and helped provoke more questions about the dataset.
See Map 1 below for the 1999 hot spot analysis results.

Map 1: Heart Disease Mortality Hot Spots