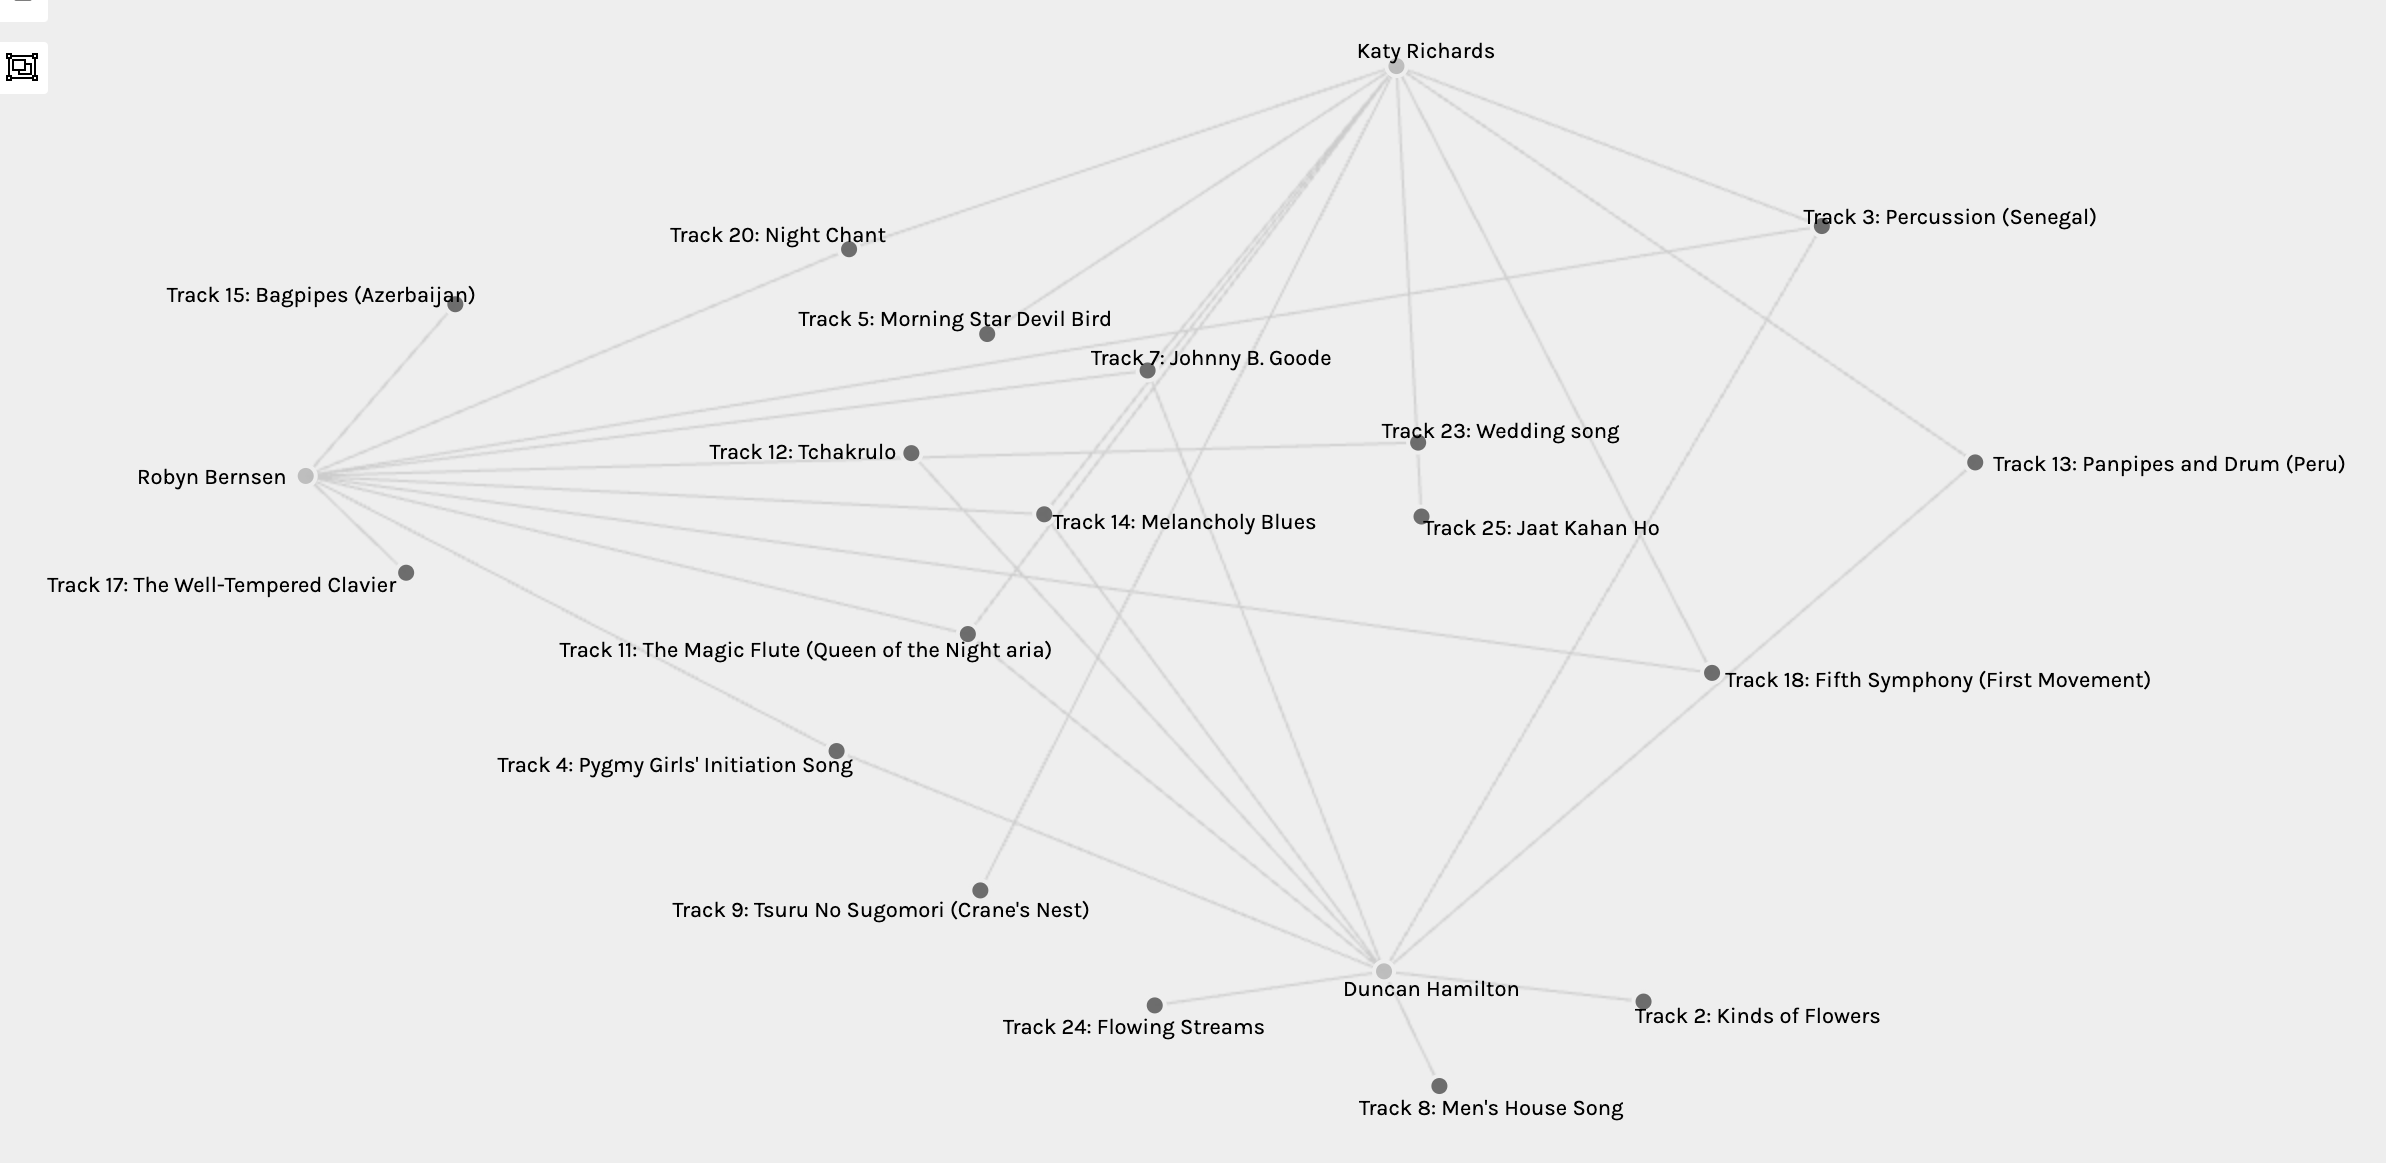
Upon completing the Golden Record assignment, the next step required my peers and I to take a quiz in an effort to gather data based on our song selections. Using the Palladio app, something that I have never done before, we were to interpret the collected data through a visual output, as shown below.
 I am not going to lie; the program was instantly intimidating. Loading the file by following the instructions was manageable but the data was immense, just take a look at the above image. However, after discovering more about the program, using Palladio turned out to be very interesting and well worth the learning curve. The app made it fairly easy to somewhat interpret the data and see different connections amongst our group. It really was like reading a new language at times because of the complexity that it came with. I found it a lot easier when clicking the different facet options based on how the program divided the students of the course. Working with the smaller groups, I tried to spread out the MET students on the perimeter of the workplace and then see how the connections happened. Spreading out the lines as much as possible made it easier for me to understand and interpret the data. I untangled every group this way and also if any student was the only person to choose a song that song would be distanced away from the rest of the data.
First, I looked for the tracks that were original to the students. Out of five members of the group, all of them had chosen songs that the other’s had not. Four out of five chose two songs that were original to them. I found this interesting that while they share commonalities, they had different selections than the rest as well. I also noted that only one song was similar between them all which was Track 18: Fifth Sympathy which is a classical number that most likely found its way onto their lists because of how well it’s known to the rest of the world.
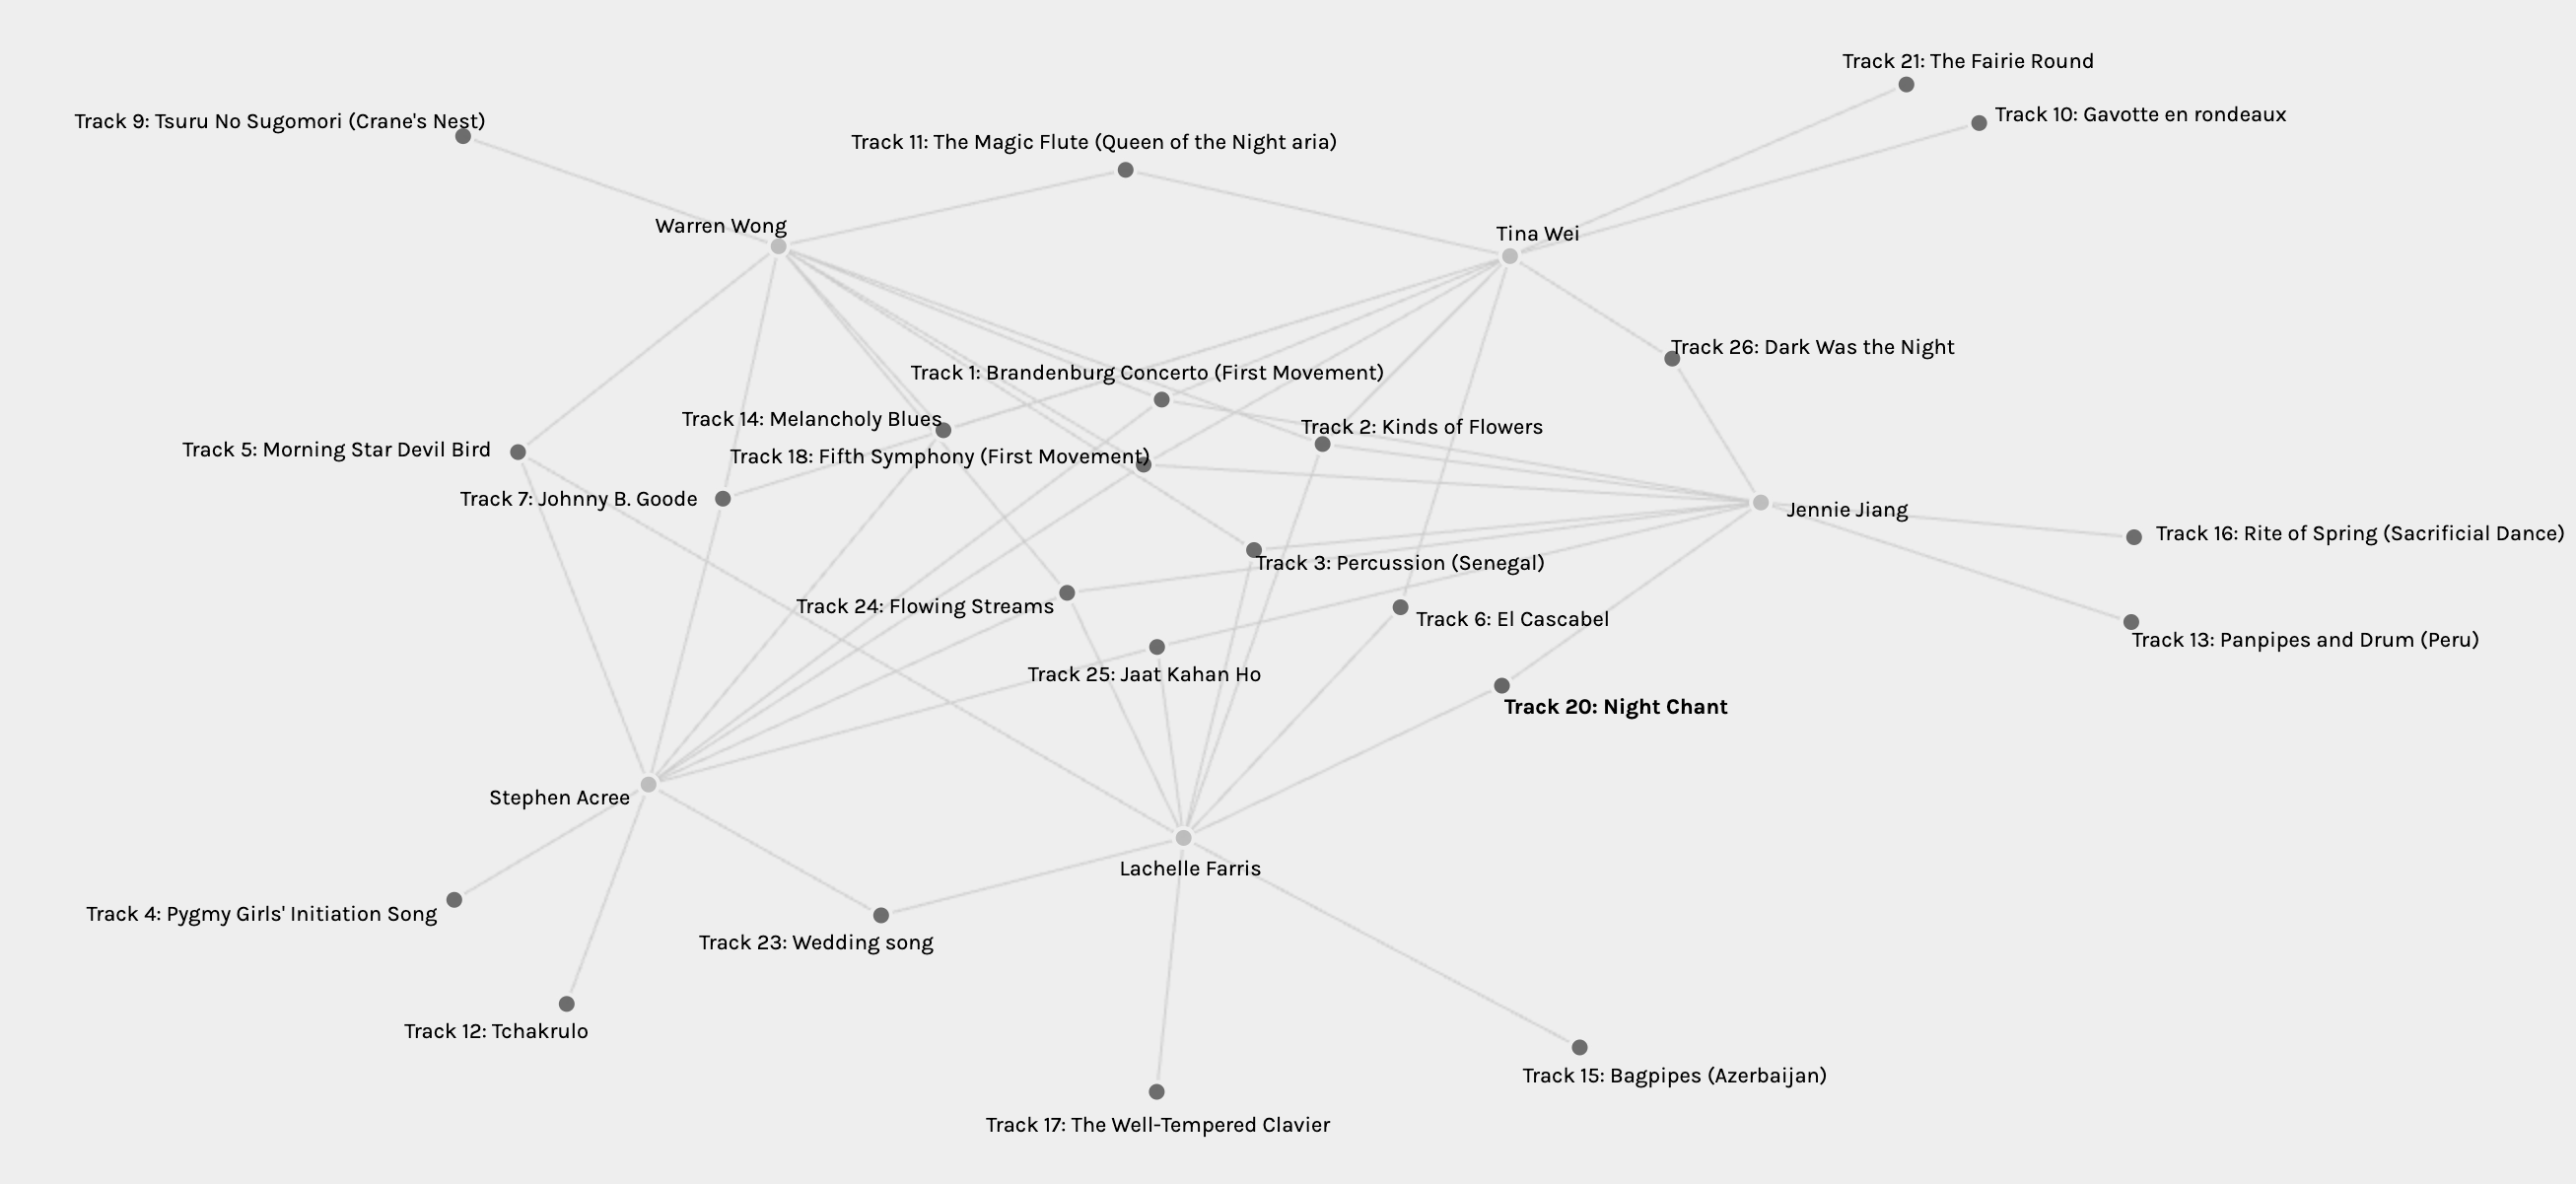
 The group that I was part of was Group two, which I was typically most interested in when comparing as making assumptions related to myself is always more intriguing. Group two had one song in common which was Track 6: El Cascabel. It is such a vibrant, Mexican, feel good song that I believe definitely belonged in our playlists based on the way it makes you feel when listening to it. While three students had unique songs chosen only by themselves, I did not have a song that I only chose. Does this make me more predictable and less original? Maybe so, because when I noticed that some students did not select Johnny B Goode to be part of their selection, I was shocked (in a humourous way of course) that they would leave off such a classic. Based on how some of their songs were selected, I would infer that their choices were perhaps influenced by the cultural significance of the tracks, while my predictability perhaps landed more songs such as Johnny B Goode.
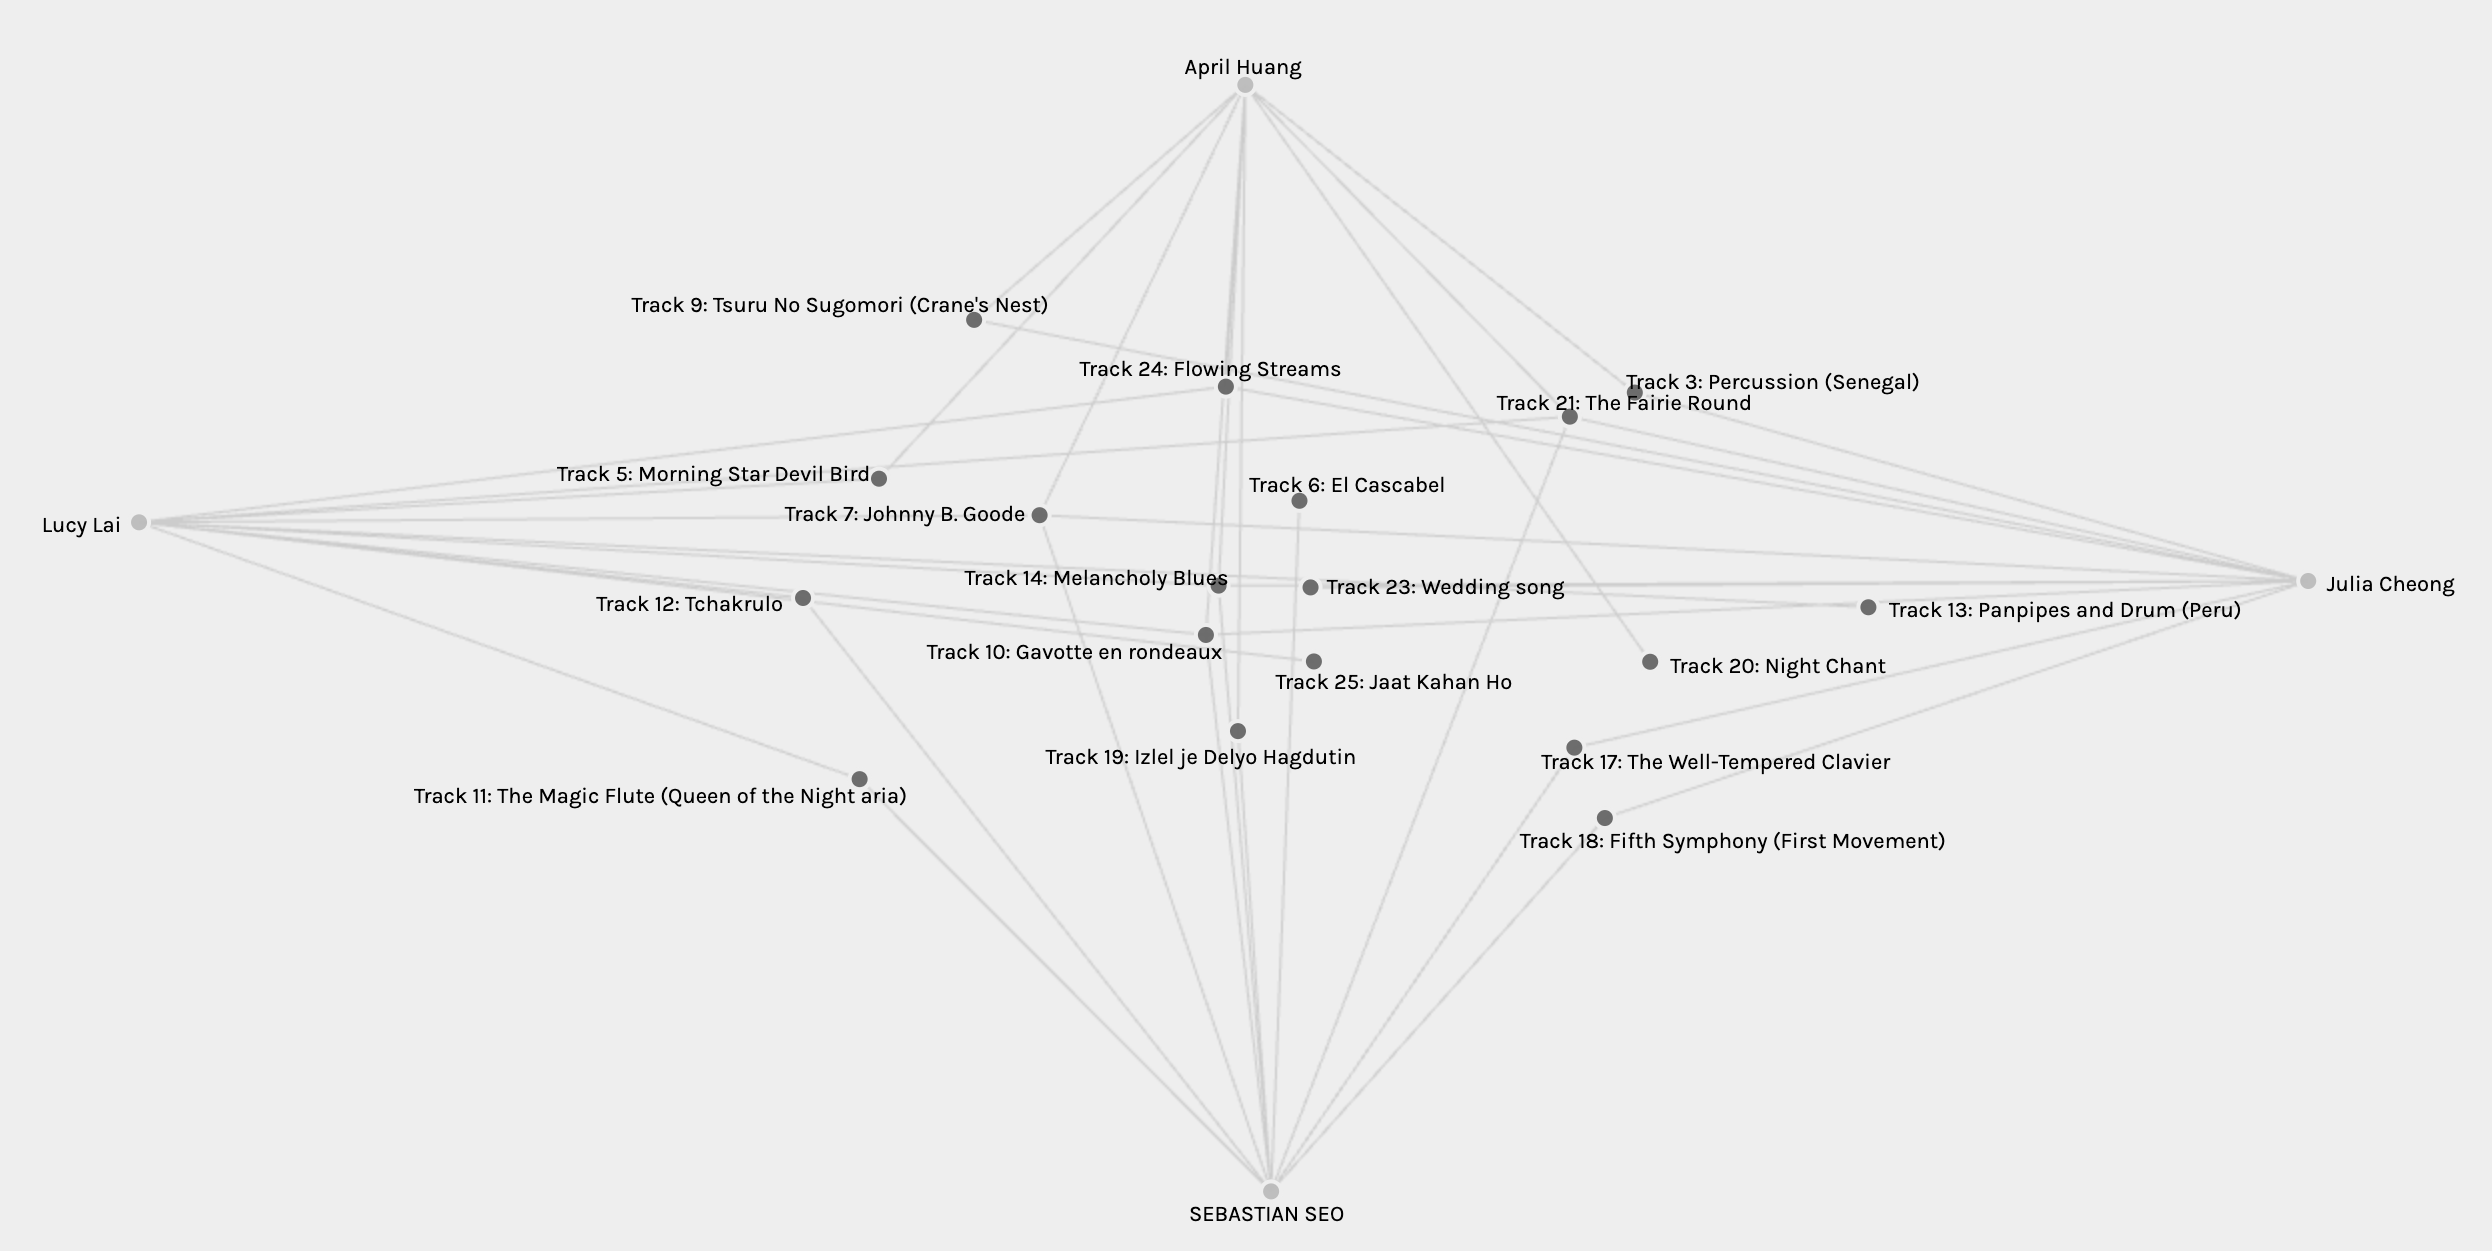
Only 4 students were part of the next group, a lot more manageable. The songs in common here were more apparent now but there were not a lot of original selections made. Some of the similar selections included Track 24: Flowering Streams, Track 14: Melancholy Blues, Track 10: Gavotte en rondeaux, Track 21: The Fairie Round and Track 7: Johnny B Goode. I find this group had a very good taste of uplifting and positive music as their commonalities were all solid choices.
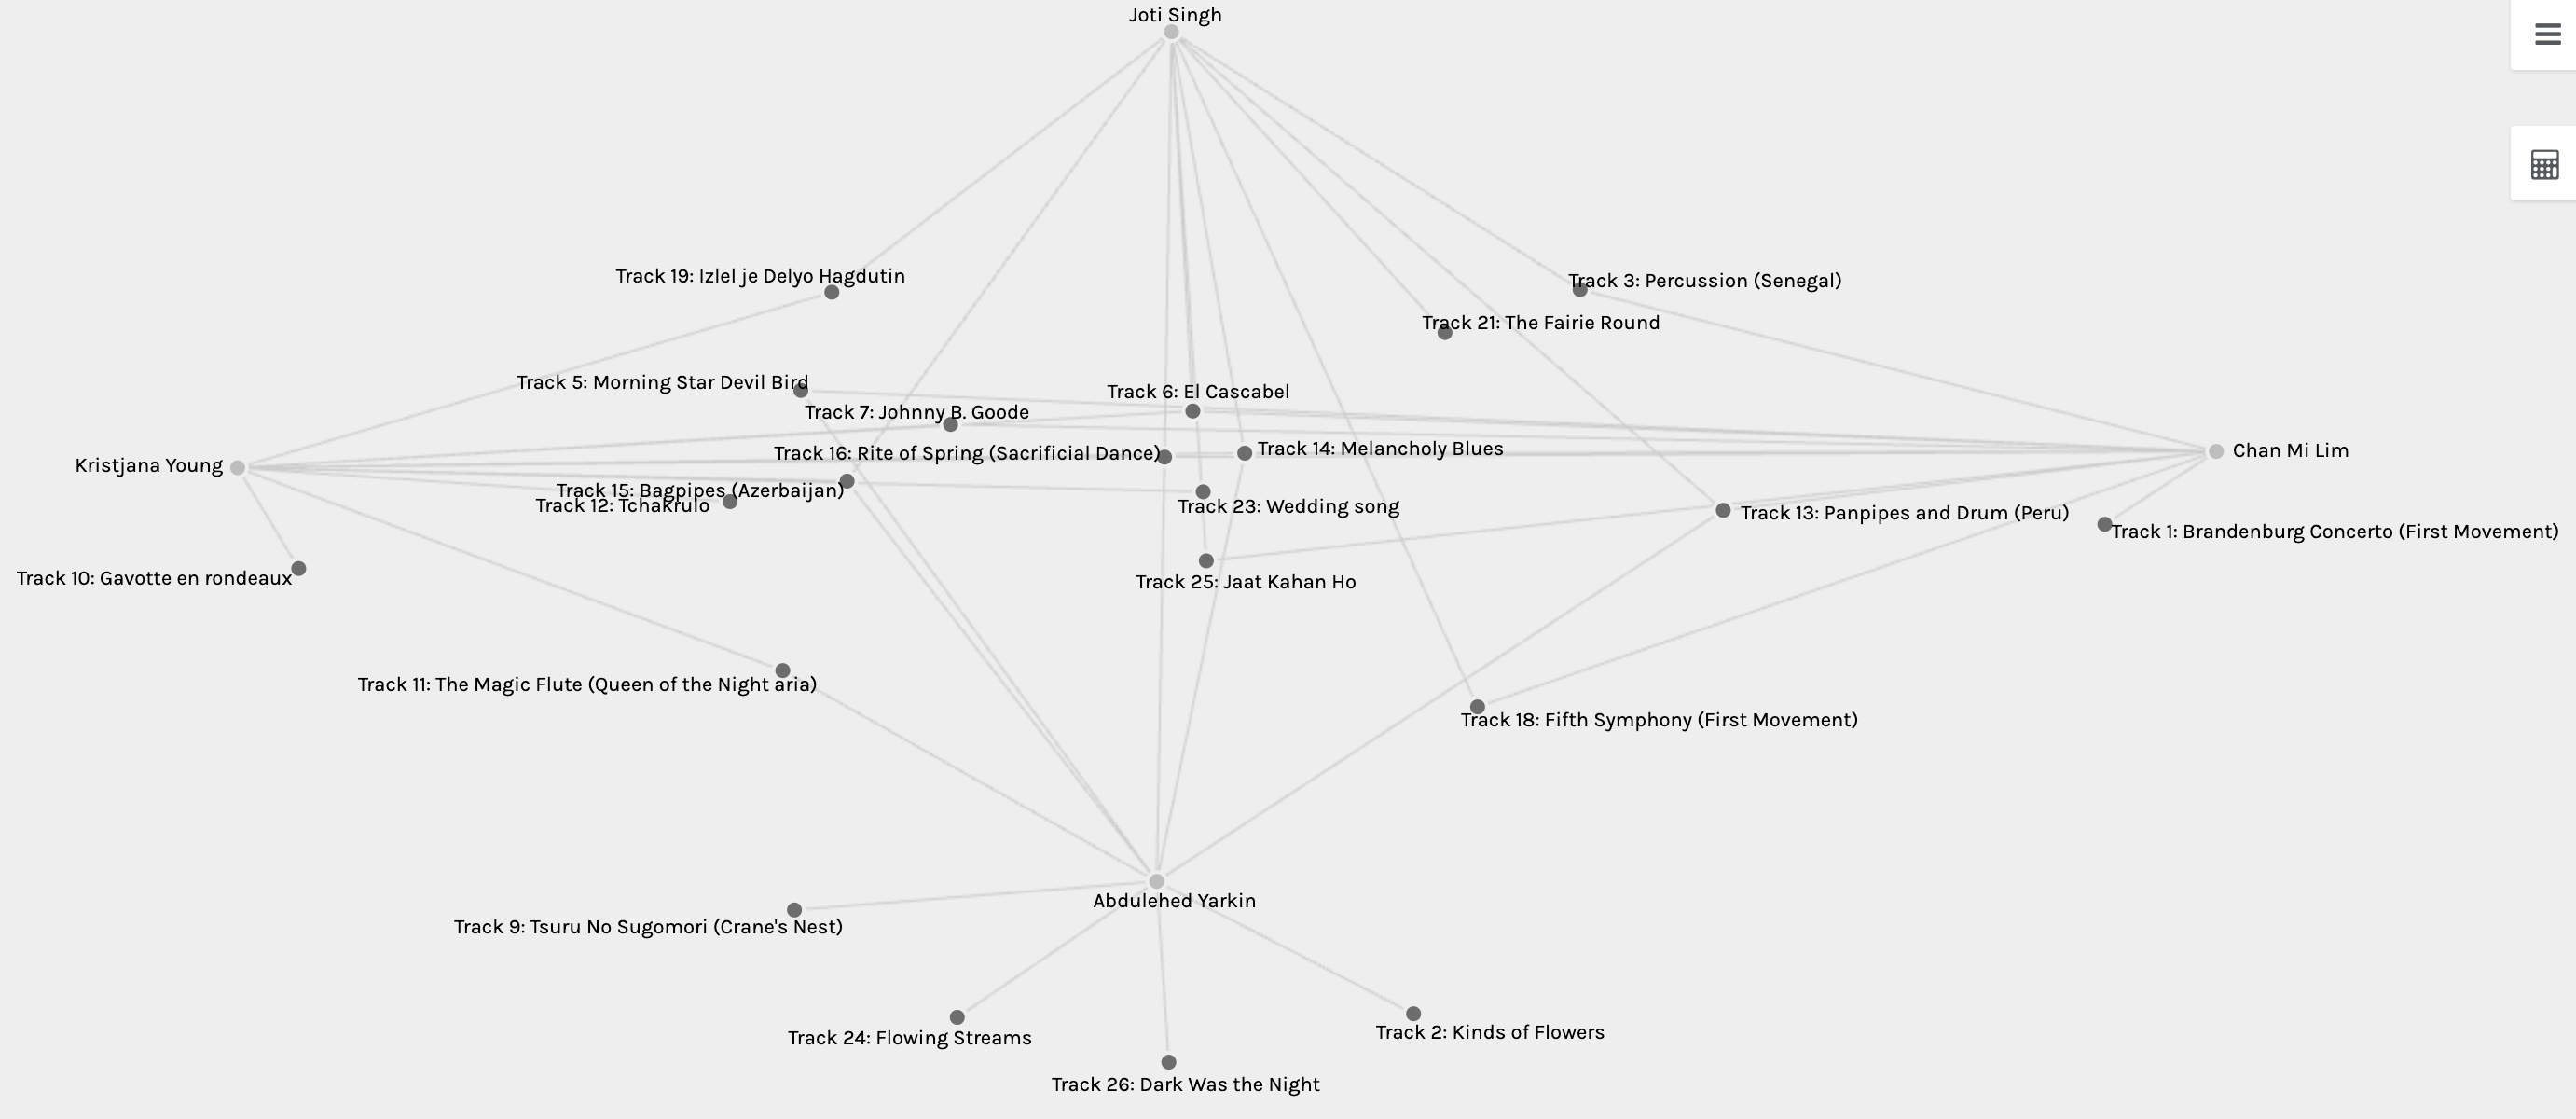
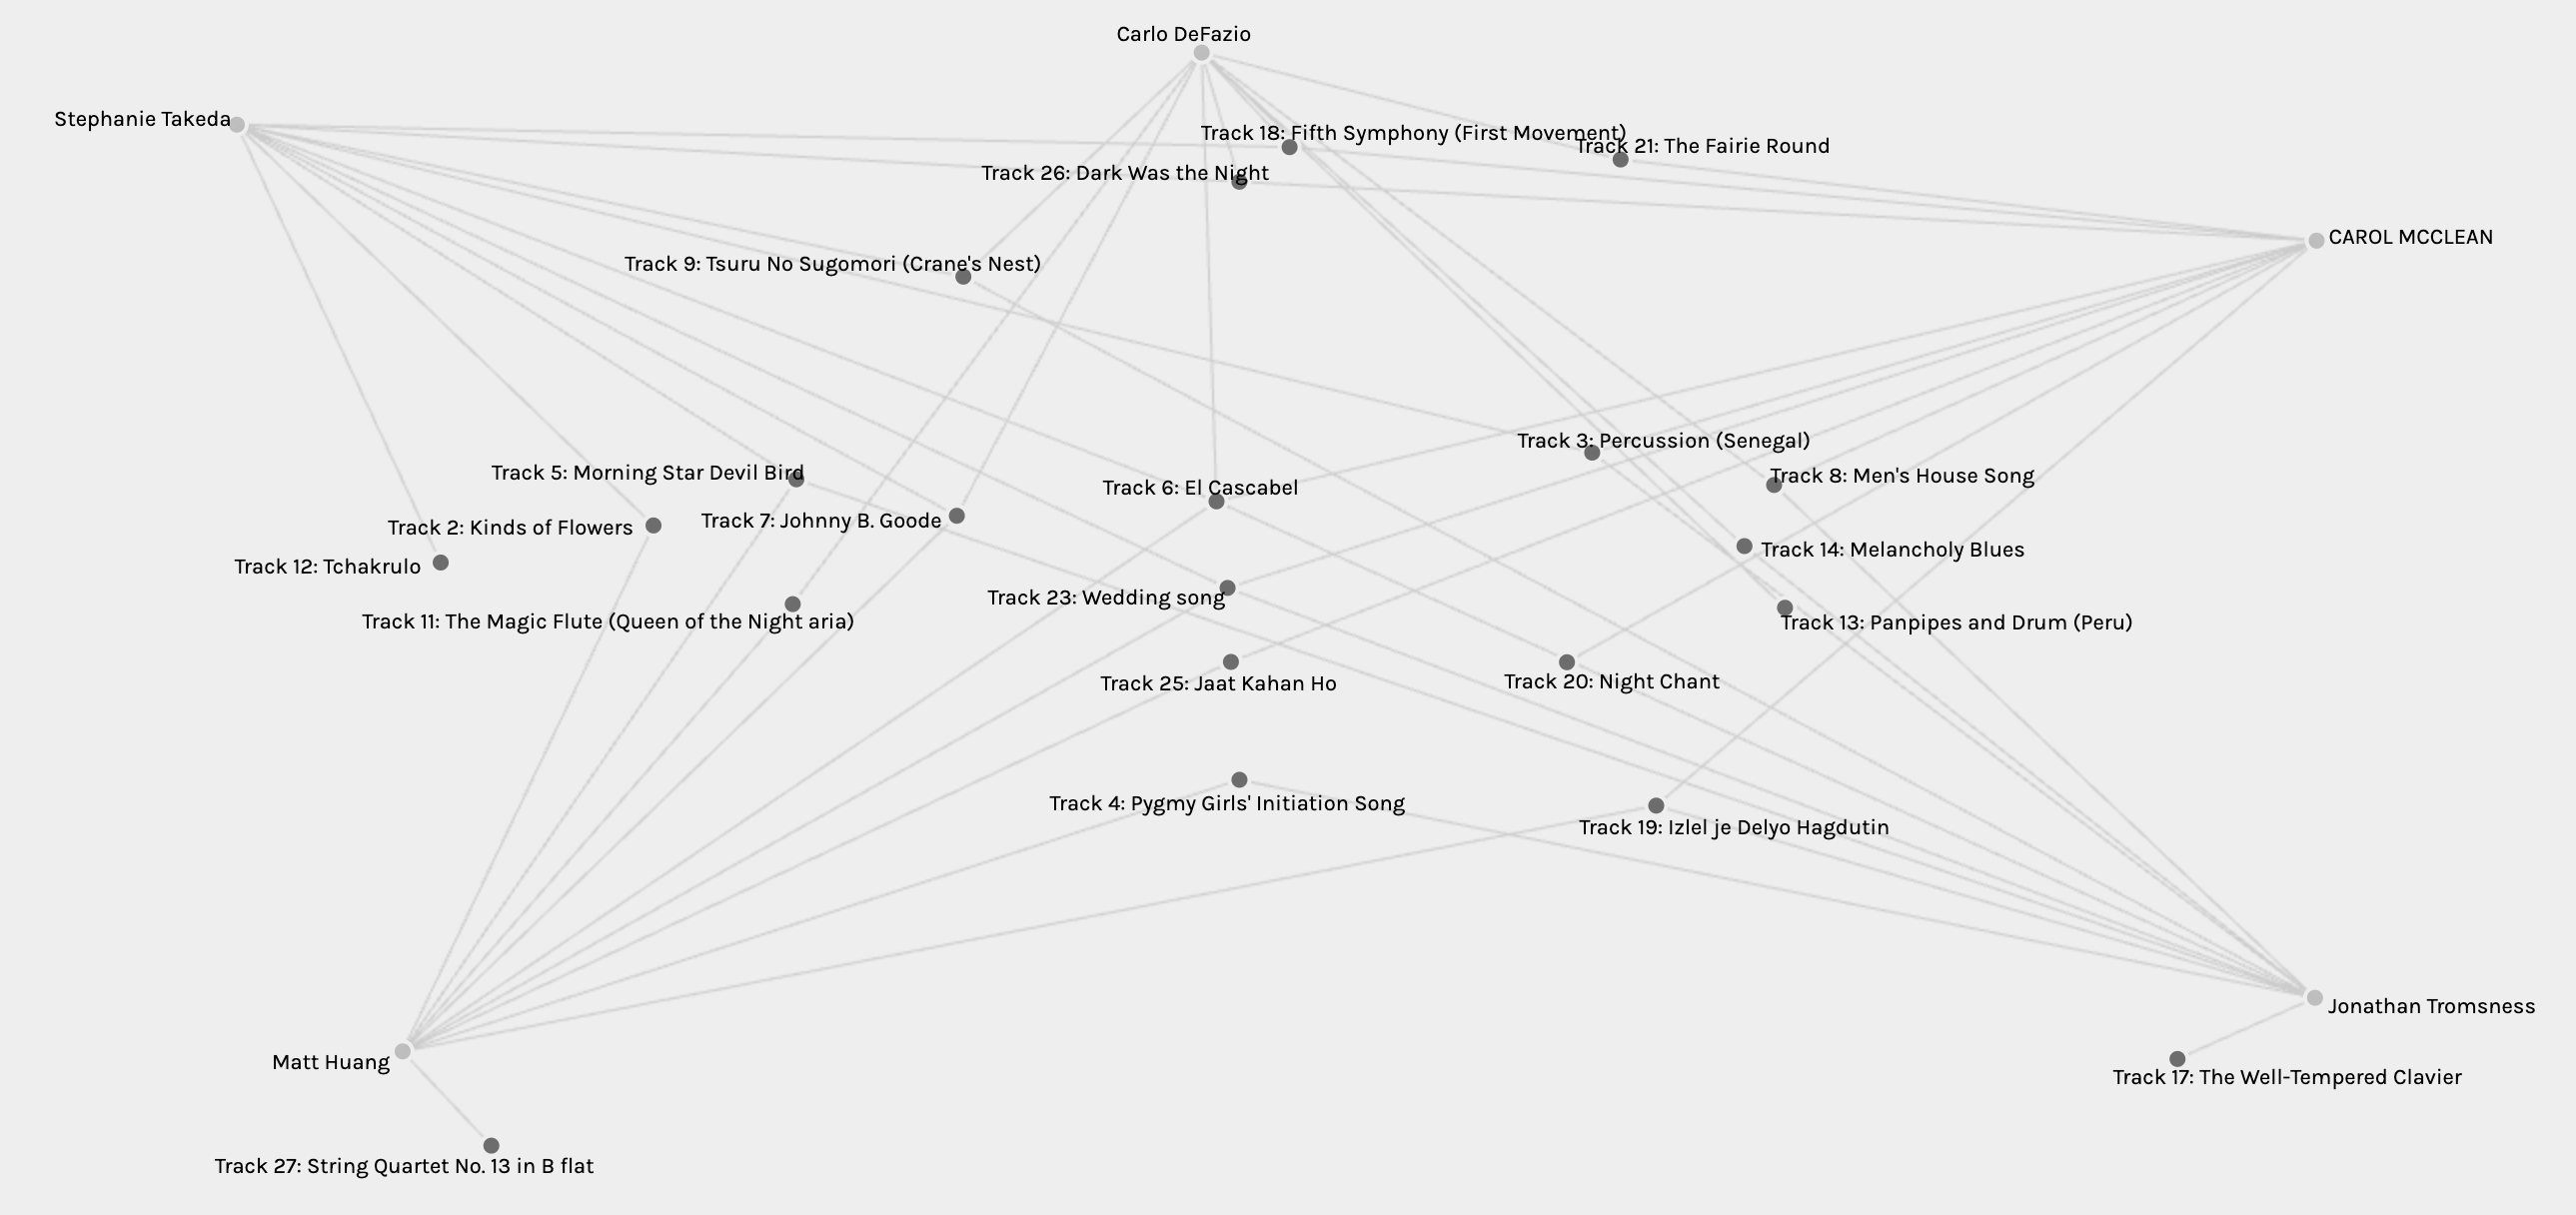
Looking at Group four, I instantly noticed that Abdulehed had four tracks that only he selected. I find that the selections that were commonly chosen were all selected because of their great musicality and that Abdulhed had some great taste in cultural music. They did not have much in common at all which showed their unique musical senses.
The next group was very unique in that they each had three of their own choices and four similar selections. These three students chose the same songs that, once again, focused on the feel good musical aspects of the list. Positive and uplifting song choices continued to be selected by most students in the groups and I feel that they best represent our group as a whole as well as the entire human race.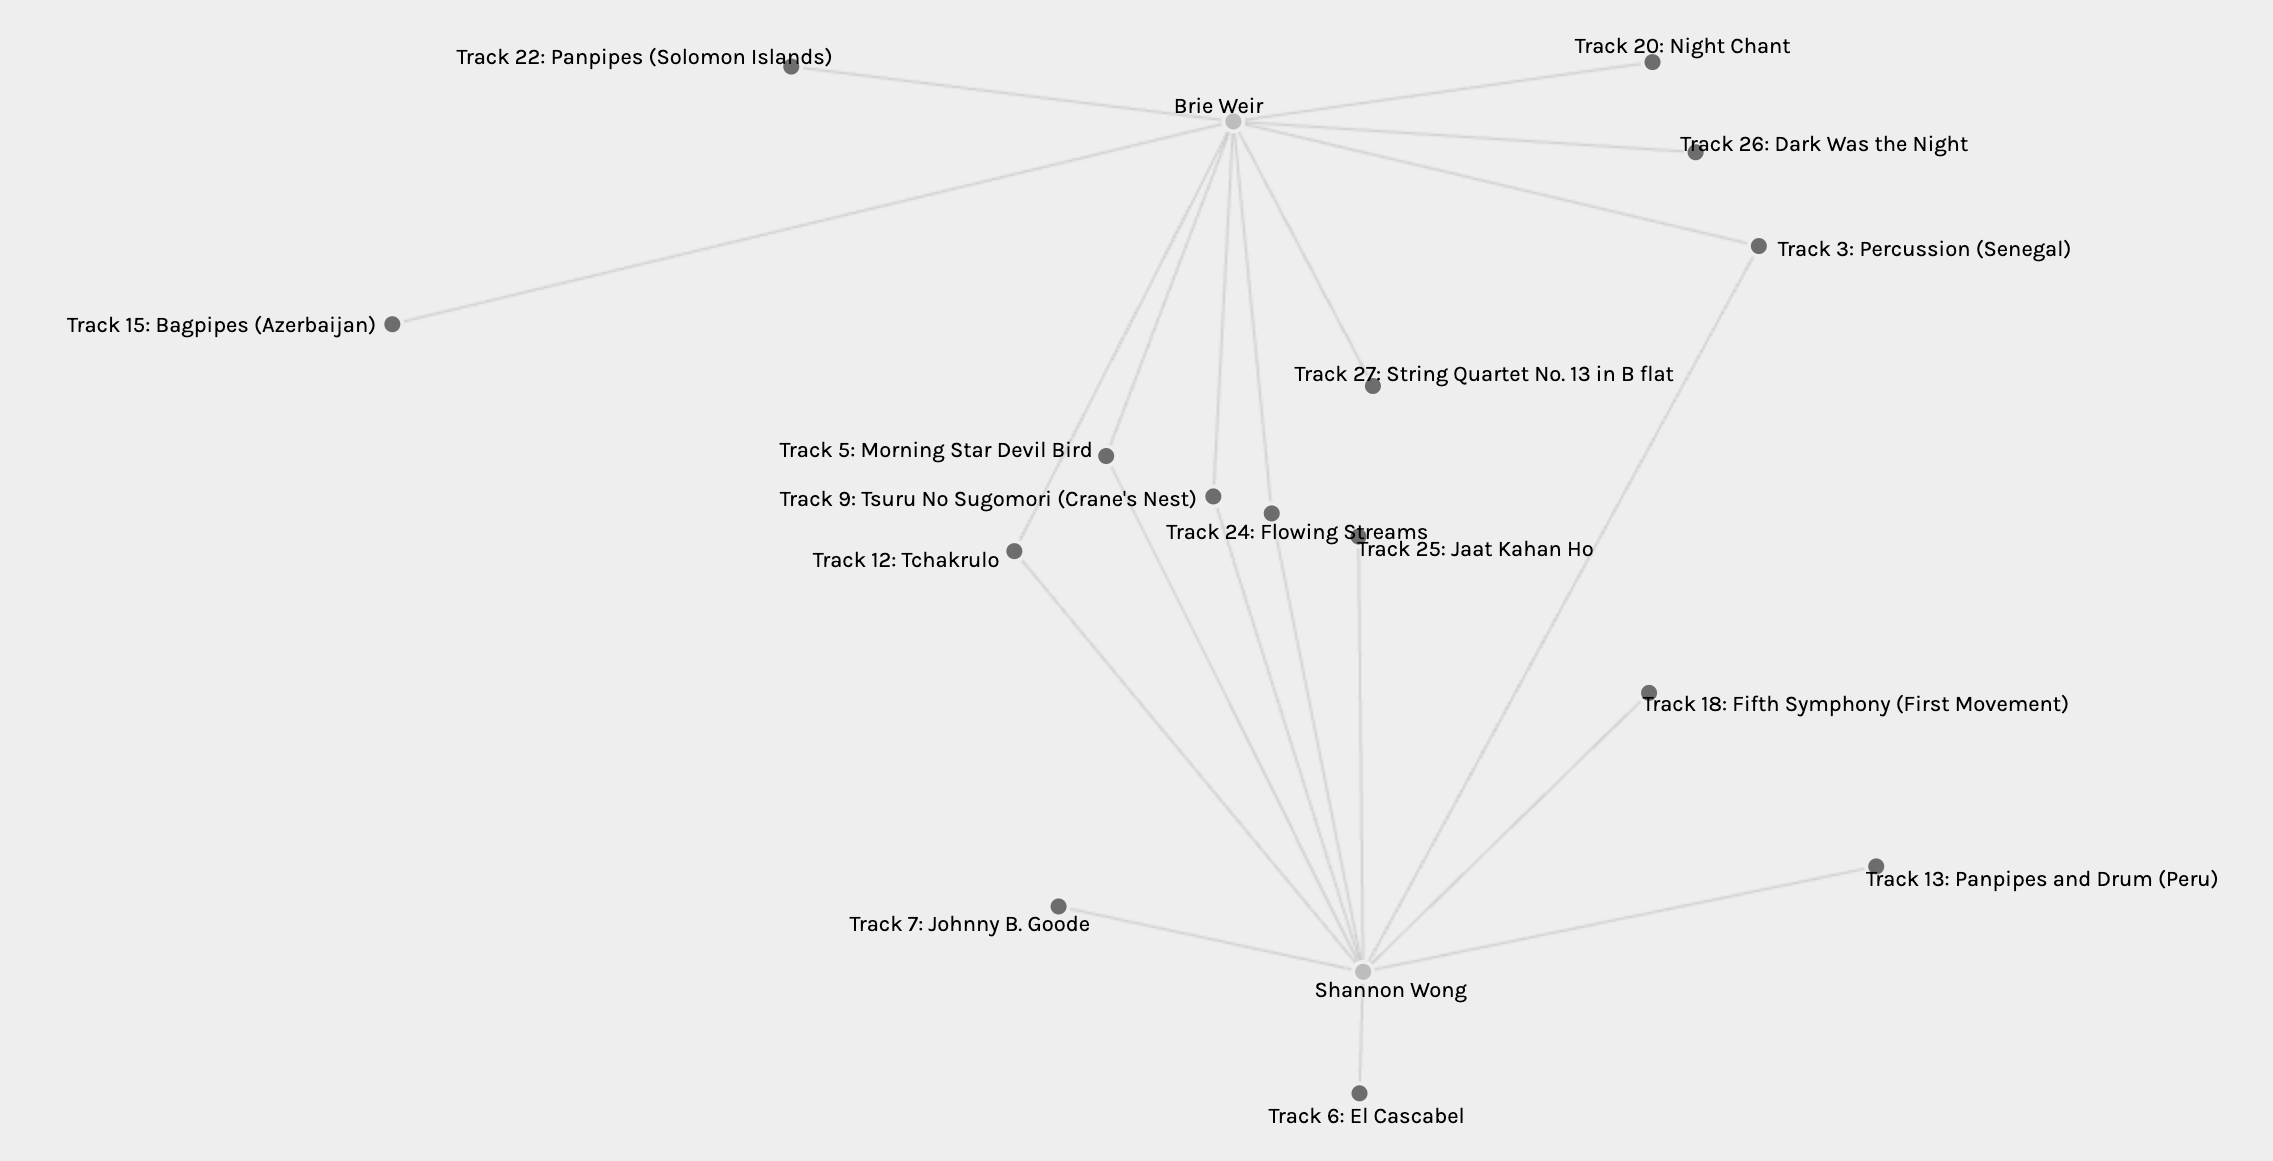
Lastly, two students were very easy to interpret as Palladio makes it easy to see their five similar choices and their other differences as well. This was obviously the easiest to separate and spread apart while the others had some errors in my screenshots as well, noticing some songs in places that I should have moved them from.
Reflection
The assignment was one that I really enjoyed and felt that it provided culture and significance to the course. It also really got me thinking on a deeper level regarding perception and predictability. I really enjoyed trying to distinguish and interpret the data involved but also realizes that it was still hard to determine why songs were ultimately selected. I felt that Palladio did an excellent job of presenting the data in a way which could be manipulated to see more clearly. The most difficult thing about the interpretation was constantly going back and forth to the song choices and re-listening before inferring why a song was selected, which was a tedious process. It would take a team to try and sort through this the proper way in the end.
I found it difficult to consider so many possibilities of song selection from what’s missing and why or why not songs were chosen. I could make assumptions but I do not feel as though other students may feel that is appropriate to do as personal preference is so unique to every individual. I could look at my own choices and question why others did not select the same songs as I did but the data would not be able to tell me this in the long run. Much like our digital footprint, we may be able to be interpreted and tracked from things in which we do or follow but why we make our choices and how they are grouped with the population is not up to us. It is simply impossible to assume data and we need to remember this always as we could be caught in certain situations grouping individuals based on selections that they make and not searching further.