
Throughout the course of ‘Planning for Flooding/Storm Surge’ Lab Assignment (Lab #3), I was asked to create a series of maps to accurately depict potential storm surge floods in Metro Vancouver. Specifically, the scenario was as follows:
Scenario: As Metro Vancouver had undergone a series of climatic/hydrological events throughout this current time period, create maps to document the storm surges that may affect certain areas of Metro Vancouver. Storm Surges could be defined as “the rising of the sea as a result of atmospheric pressure changes and wind associated with a storm” (as quoted from Lab #3 instructions hand-out). Hence, storm surges could significantly affect areas of Metro Vancouver due to the risks that it accompanies, including flooding (which is affected by winds, tides, waterways, elevation and etc). The purpose of these maps is to outline the potential danger zone of the storm surge at low elevation (where the storm zone would be most impacting), below 10 meters or less and lie up to 1 kilometer of the shore line.
I have created the following maps in order to accurately represent the risks of storm surge below:
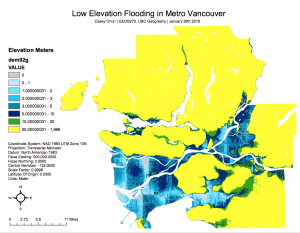
Maps 1: Map of Metro Vancouver and all the areas of potential flooding via storm surge, depicts the elevation from 0-10 meters
Maps 2: Another map of Metro Vancouver showing areas of potential flooding with legend
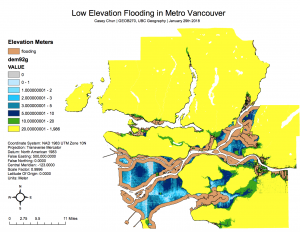
Map 3: Map of potential flooding within 1km of shoreline
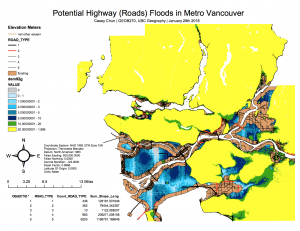
Map 4: Map of potential flooding on all the roads in Metro Vancouver, with a table summarising the total length being affected
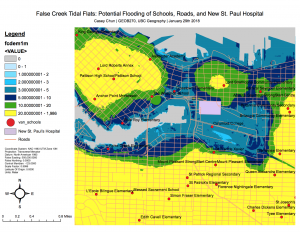
Map 5: Map of False Creek tidal flats area, showing potential flooding and it’s effect on nearby schools, new St. Paul’s Hospital location and elevation
Full Resolution of the maps can be found below: