
Whilst completing Lab #4 on Housing Affordability, I was able to create a series of maps that demonstrated the different classification methods GIS software provides. Including those of natural breaks, equal interval, manual breaks and standard deviation. As each type of classification method yields visually different maps, I utilised all 4 types to analyse housing affordability in Metro Vancouver. The scenario was as follows:
Scenario: Often geographers need to work with census data that is gathered, analyzed and displayed by national government organizations (example Statistics Canada). Census data is utilized in many geographic analysis research projects: urban planning, immigration, social geography, environmental justice, crime prevention, transportation planning, policy analysis, etc., and all of these topics can be explored using GIS. Many of you will use Canadian Census Data for your final projects.
Every 5 years, Canadians are surveyed. Previous to the 2011 survey, 80% of the population completed the ‘short form’ and 20% of the population completed the ‘long form’, where more detailed information is captured. In particular, the ‘long form’ included socio-economic data including income, dwelling type and value (the topic of this lab), transportation data such (modes of transportation for commuting) and immigration data. The former Canadian conservative government changed census policy for 2011; the long form was not mandatory but voluntary. This has impacted the quality of the data, and makes it challenging to compare to previous years. The 2011 Census is referred to now as 2011 NHS for national household survey. The next survey was conducted in 2016, with the long form reinstated for 20% of the population, and the data was finally all released in the fall of 2017. For this lab, we will use 2011 and 2016 data on cost of dwelling, or housing cost, to visualize change over 5 years. To note is the 2011 data is not as reliable as 2006 and 2016.
Statistics Canada creates different census map areas based upon population. In Metro Vancouver, for this lab, we will be using 2 different census areas: Census Tracts (CT) and Census Dissemination Areas (DA). Statistics Canada draws census boundaries on maps for CT and DA based upon the number of people living in the area. DAs are finer resolution with a DA being sometimes less than a city block, sometimes just an apartment building, whereas CTs are coarser resolution, and one CT makes up a few city blocks.
Maps 1, 2, 3, 4: Natural Breaks, Equal Interval, Manual Breaks, Standard Deviation
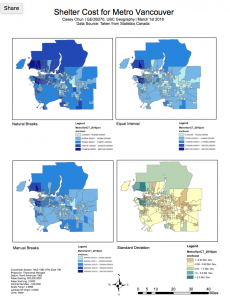
Full resolution of the maps can be found below: