Author Archives: Chelsey-Ann Cu

Planning for a Tsunami

Health care facilities in danger zone:

  • False Creek Residence
  • Broadway Pentecostal Lodge
  • Yaletown House Society
  • Villa Cathay Care Home

Education facilities in danger zone:

  • Anthony of Padua
  • Ecole Rose Des Vents
  • False Creek Elementary School
  • Emily Carr Institute of Art and Design
  • Henry Hudson Elementary

I got these results by first intersecting the land use layer data with the danger zone layer data.  Then I intersected the new resulting layer with the healthcare facilities location data and the educational facilities location data respectively. This gave me the remaining points of which healthcare and educational facilities are currently located in the danger zone and are at risk of flooding should a tsunami hit Vancouver.

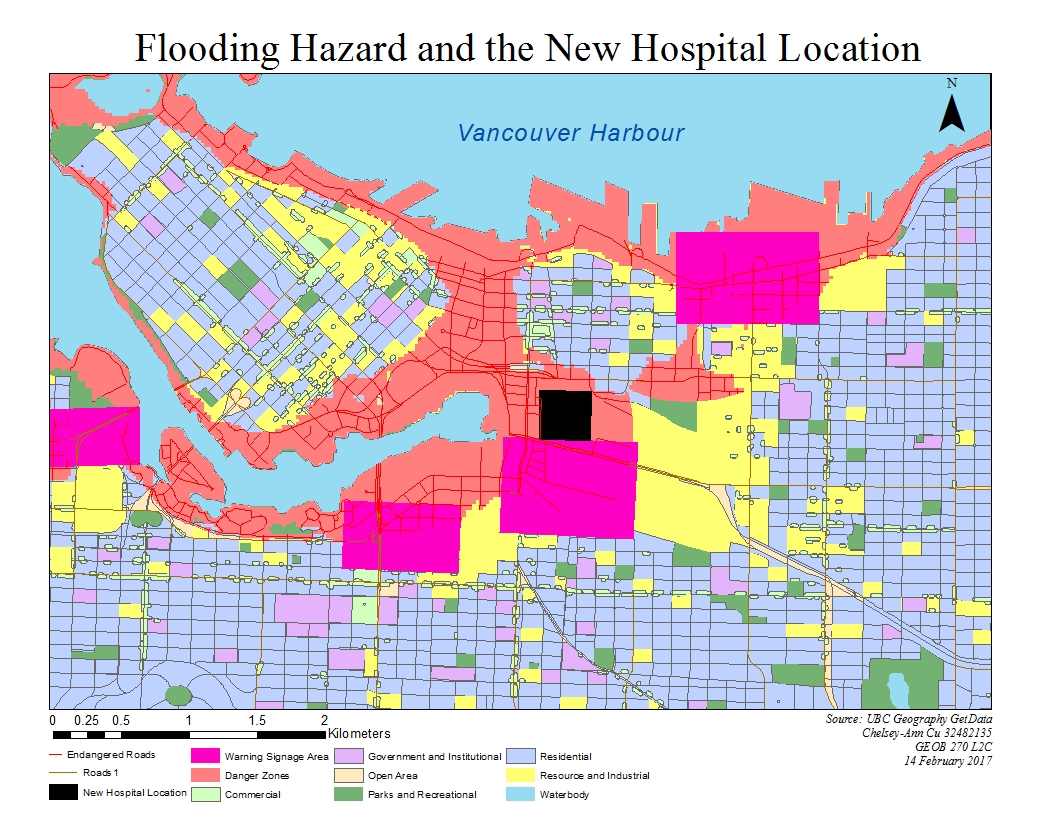
The new site for St. Paul’s Hospital is located in the danger zone. This means that if there were to be a tsunami and subsequent flooding, the hospital would have to be evacuated or it would not be accessible if the surrounding roads were flooded. Since it will be a major healthcare facility for the east end, this might lead to problems in the event of an emergency.

Recap of learning: Working with both spatial and tabular data, I was able to identify and create a map of areas that are prone to flooding in the event of a tsunami. I was then able to locate the areas that will require warning signage as well as determine whether the proposed location of the new hospital will be affected.

Advantages to Using Remotely Sensed Landsat Data for Geographic Analysis

Remotely sensed Landsat imaging data provides space taken images of the Earth’s surface at 16 day intervals. Initially launched in 1972, this tool is a source of raster data that can be crucial to geographic analysis. Its ability to provide repetitive and synoptic observations of the Earth, makes it useful in giving data on how land use changes over a span of time (which can be a long or short interval). This data is used in a variety of ways by allowing users to determine the rate and distribution of surface processes.

An example of when Landsat data would be useful is the when looking at the disappearing swamp in the Apalachicola delta in Florida. The Landsat data allowed researchers to “distinguish between hardwood swamp, the typical forest in the Apalachiocola River floodplain, and the bottomland hardwood forest, the encroaching forest that thrives on drier soils.1” These changes are important because they can negatively impact the biodiversity in the area. Landsat images in this case can not only distinguish between forest types, but also water levels in the river to help determine changing rate of the forest and its possible relation to water levels.

Recap of learning: I have discovered the usefulness in constant areal photographic monitoring of the Earth. This up to date data helps with making the most accurate interpretations when doing spatial analysis.

1 http://landsat.gsfc.nasa.gov/apalachicolas-disappearing-swamp/

Misaligned and Improper Spatial Data

Fig 1. Coordinate System: Canada Lambert Conformal Conic. Projected layers: Canadian national parks and rivers. Cities: Vancouver and Halifax

ArcMaps does this nifty thing called Projection-on-the-Fly, which allows users to combine layers set to different coordinate systems and still have them align with each other. It is useful in some cases, but it does not always work. Sometimes, you my find that your map layers do not line up. Not to worry, the solution may be as simple as incorrect coordinate systems. Maps that are used in layering may be set in different coordinate systems (also known as spacial referencing) which results in a mismatch of layers.

To fix improperly referenced spatial data, right click on the lowest layer of your map (this is the last on your list in the Table of Contents) and look at the properties > source > spatial referencing. Check what coordinate system (spatial referencing) this layer is on. Then, right click on Layers (this this is the first item on your Table of Content list) go to properties > coordinate system > layers > (pick the one that matches the coordinate system you previously checked for). Now that your map is all on the same coordinate system, everything should hopefully line up nicely.

Discrepancies in location and scale lead to misaligned layers. To fix this, launch the properties of the layer in the Catalog tab. Find XY coordinate system > geographic coordinate systems. Now, make sure to select the the coordinate system that fits the original information.

Let’s go one step further. Say you want to project a layer for spatial analysis. Projecting a layer modifies the coordinate data and creates a new version of the data layer with a different coordinate system. This means that you must use a special tool in ArcCatalog to perform the transformation. Dock ArcToolbox on the right side panel. In ArcToolbox, find Data Management Tools > Projections and Transformations > Project. Make a new layer, which will appear in your ArcCatalog. Drag this to your Table of Contents and add it as a new layer to your map.

Ensuring that all the data lines up is crucial for accuracy in mapping. This may not be a bid deal in small scale mapping, but for large scale maps, inaccuracy can lead to major issues. Imagine trying to go hiking with a map that is 400 km off!

Recap of learning: I learned not only how to change the coordinate system of a map but also the misinterpretation that wrong projections can cause. I’ve begun to figure out which projections work best for which maps and in doing this, learned how to determine if map projections are skewing data.