City Trees’ Negative Influence on Nearby Houses
—-2019 Winter Term 1 GEOB 370 Advanced GIS Course Final Project by Tingfang (Tina) Zheng

ArcGIS in real-world problem analysis.
—-2019 Winter Term 1 GEOB 370 Advanced GIS Course Final Project by Tingfang (Tina) Zheng

ArcGIS in real-world problem analysis.
Trees are good contributors in urban landscaping. However, trees can also cause negative influence at different levels to its surroundings. The uncontrollable growth of the canopy could block sunlight from nearby houses. And during windstorm, fallen trees could cause huge damage to traffic and people’s property.
The current management of the city’s public trees was fully relying on residents’ damage reports, which means actions have only been taken after the damage (Street Tree By-law NO.5985, 1992). According to the historical record, only 30% of the potential problems of the trees were reported before the damage (VanConnect, 2019). This method is ineffective and inefficient because of three major reasons. Firstly, many people that are lack of professional training cannot precisely assess the possibility of tree fall, so they do not recognize the danger before the actual damage. Thus, they will not report the issue. Secondly, many people want to report the issue but become unable to report. Because they are confused by the complexness of the online report system, and their phone call can never be reached due to the frequently busy emergency line. Finally, it takes a long time for the city to respond to an issue.
Therefore, I decide to analyze the potential negative influence of urban trees in advance. And this project will provide an idea on how to prevent the negative influence of city trees in advance by imitating the real-world tree shadow coverage on houses and tree falling situation in ArcGIS. The objective of this project is to find the potential canopy shade coverage on nearby houses, and predict the potential falling direction and damage areas when a windstorm comes. The study will be conducted on one neighbourhood with high volume of street trees: Dunbar north region around Balaclava Park.
Source: City of Vancouver Open Data Portal
Time: 2013, latest modification: May 16th, 2019 ***
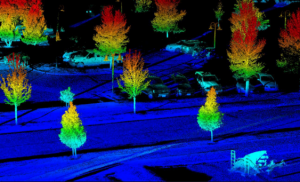
Note: There was a new LiDAR data of 2018 published on Nov. 20th, 2019. But by the time, I have already finished this project. The inaccuracy caused by the old LiDAR data will be discussed in discussion section.
Source: City of Vancouver Open Data Portal
Time: 2009, latest modification:May 7th, 2019
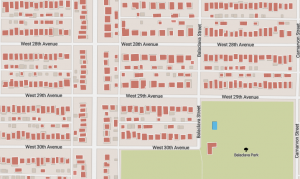
Source: City of Vancouver Open Data Portal
Time: 2016, latest modification: November 11th, 2019

Source: City of Vancouver Open Data Portal
Time: 2015, latest modification July 26th, 2019
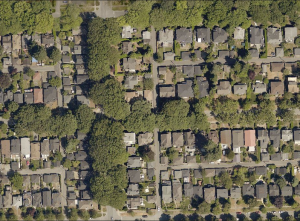
Study area has been selected based on following criteria:
After applying all the condition, a study area at the North of Dunbar community and around Balaclava Park. This study will mainly focus on houses at Blenheim Street. This area has a size around 0.3 km2 (based on google earth measurement).
The raw LiDAR data in LAS format was converted to LAS dataset. And projection was added for it to be readable by ArcGIS. Then, the tree data was generated and converted to DEM data by filtering the LAS dataset using return value of 3, which represents lower vegetation (trees that are shorter than 8m) and return value of 5 which represents high vegetation (trees that are taller than 8m). Also, ground DEM data was generated and converted from LAS dataset using return value of 2. Each cell size was set to 1.5 meters. In order to obtain the height and crown size of trees, the ground layer was subtracted from the tree layer, and the new data is the DEM of tree that I will be working on later.
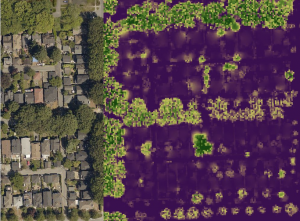
Figure 1. The DEM (right) containing tree height and crown size compared with real-world (left) data to ensure accuracy.
The shadow on the ground can be calculated using a DEM and hillshade tool (Li et. al., 2005). When conduct shadow analysis, three factors should be considered: sun’s position, tree’s crown size and tree species. The first one is the sun’s position. The shadow is caused by trees blocking sunlight at certain sun altitude and azimuth. Since the earth has a tilt axis and is rotating around the sun, the sun altitude and azimuth will change rapidly. Therefore, a specific time should be determined to get precise altitude and azimuth value that will be used in hillshade calculation. The second factor is the tree’s crown size. The crown size is different in each season due presence of leaves. In the summer, the canopy coverage is at the maximum value, and in the winter, the canopy coverage is at the minimum value. Thus, two analyses, summer and winter, should be made to show the seasonal difference. The third factor is the tree species. As we know, only deciduous tree species will shed its leaves in fall. Therefore, the tree species in this study area should be cross-check with the street tree attribute to ensure its crown size in winter.
Next, two specific date and time of July 9th, 2013 at 11 a.m. and Nov 19th, 2013 at 11 a.m. were selected to present summer and winter influence. On July 9th, 2019, the sun has an altitude of 52.23 degree and azimuth of 123.19 degree, and on Nov 19th, 2019, the sun has an altitude of 20.20 degree and azimuth of 166.25 degree (SunCalc, 2019). and all the trees in this study area has been confirmed to be deciduous species.
The hillshade functions with corresponding input altitude value and input azimuth value were applied to tree DEM. The results were called “summer shade” and “winter shade” respectively.
Then, the results were reclassified into 2 categories, light and shade. In the result of “summer shade”, all cells with values that are greater than 1 were reclassified to 1 (ArcGIS Help). The winter break value was set to contain less of the cells than summer, since the tree do not have leaves during winter.
a) 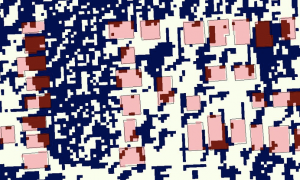
b)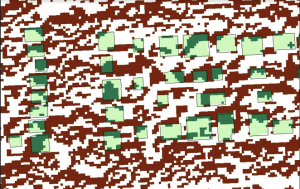
Figure 2. The hillshade calculation result (partial map). Summer shade coverage on the top (a), and the winter shade coverage on the bottom (b). In a), the dark red indicates the shadow on each building, the light red indicates that the sunlight will not be blocked by trees. The background of the dark blue points is the reclassified hillshade result. In b), the dark green indicates the shadow on each building, the light green indicates that the sunlight will not be blocked by trees. The background of the dark red points is the reclassified hillshade result.
There are two obstacles with the tree height data sets. First, the street tree data found from Vancouver open data catalogue only recorded the tree height in height range class (i.e. 0-10 for every 10 feet, such as 0 = 0-10 ft, 1 = 10-20 ft, 2 = 20-30 ft, and 10 = 100+ ft) , which is not accurate for the following analysis. Second, trees are continuously growing every year. Therefore, in order to analyze the current influence of the tree, the height of each tree should be corrected. A tree guide was consulted to find the average growth rate of each species presented in the study area. The growth rate of each species was summarized as follows:
| Genus Name | Species Name | Common Name | Growth Rate (cm/y) | Mature Size (m) |
| Acer | Platanoides | Norway Maple | 45 | 22 |
| Quercus | Coccinea | Scarlet Oak | 40 | 22 |
| Quercus | Palustris | Pin Oak | 40 | 24 |
| Quercus | Rubra | Red Oak | 40 | 23 |
| Fraxinus | Pennsylvanica | Bergeson Ash | 60 | 18 |
| Fraxinus | Ornus | Flowering Ash | 50 | 18 |
| Ulmus | Americana | American Elm | 78 | 19 |
| Ulmus | Pumila | Siberian Elm | 70 | 19 |
| Ulmus | Glabra | Scots Elm | 75 | 19 |
| Fagus | Sylvatica | Golden Dawyck Beech | 45 | 18 |
| Betula | Pendula | European White Birch | 60 | 21 |
| Prunus | Cerasifera | Pissard Plum | 35 | 8 |
| Prunus | Serrulata | Pink Perfection Cherry | 35 | 8 |
(Find Trees – Tree Guide, 2019; E-Flora BC, 2019)
The current height of each tree was calculated using field calculator and applying formula: Current Height = (height range id) *304.8+3 years*annual growth rate, then the results of current height of each tree were adjusted manually to make sure that it did not go above the mature height, which is the maximum size of each tree.
Firstly, the damage range of each tree were plotted by applying buffer of each tree’s current height, this provided a maximum range that can be influenced by a fallen tree.
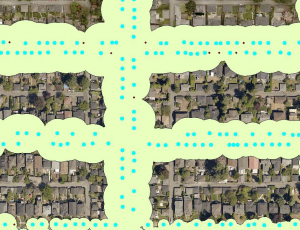
Figure 3. the potential damage area of each fallen tree. The blue points indicate each big tree’s location. The red points indicate each small tree’s (less than 4m) location, since their height are too short and crown sizes are too small, no buffer is applied to them. The yellow region indicates the potential damage area.
Then, Euclidean direction function was applied to each tree to get its fallen direction. However, the Euclidean direction only provide output value based on compass direction, and in real life the tree always falls to downwind direction (Rentch, 2010). Thus, this analysis used the wind data of Oct 25th, 2019 to predict damage. According to Vancouver historical Wind Direction, on Oct 25th, 2019, the strongest wind was blowing at 270° at a speed of 76 km/h (Vancouver Historical Wind Speed, 2019) and this wind is strong enough to cause damage. Finally, reclassify and recolour the fallen direction according to wind direction.
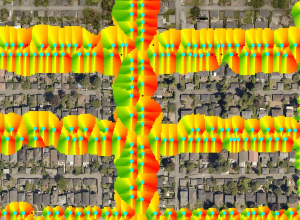
Figure 4. The falling direction of each street tree. Red indicates the most possible falling direction, yellow indicates the less possible falling direction, and the green indicates the impossible falling direction.
To study the damage on each nearby house, using the falling direction data form pervious step and then “extract by mask” to find the potential damage on each nearby house.
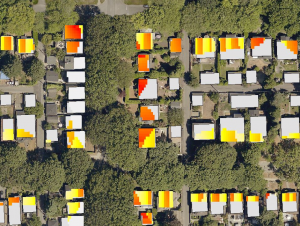
Figure 5. the potential fallen tree damage on each nearby house on Oct. 25th, 2019. Red indicates a high possibility of being damaged, yellow indicates a fair possibility of being damaged, and grey indicate a low possibility of being damaged.
Tree Shadow Influence Analysis of North Dunbar Community during Summer
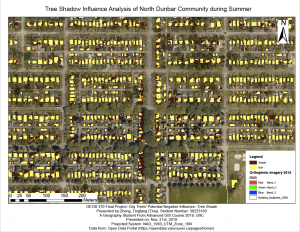
For Detailed map see link:city_tree_shade_summer
Tree Shadow Influence Analysis of North Dunbar Community during Winter
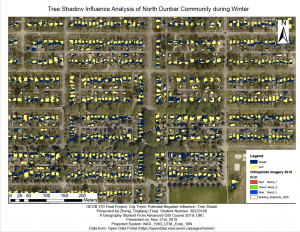
For Detailed map see link: city_tree_shade_winter 1
Tree Falling Damage Influence Analysis of North Dunbar Community
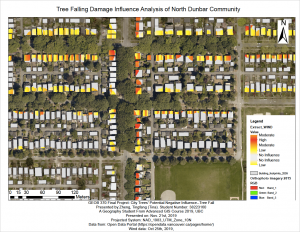
For Detailed map see link:city_tree_wind
The above GIS analysis was conducted under an idealized situation. In reality, the actual tree shadow influence is subject to sunlight intensity, and the falling tree damage is subject to wind power, tree truck firmness and tree height. However, this analysis can still prove that the unmanaged city can have potential negative influence on nearby houses.
Form the results of the first and the second maps, we can see many nearby houses stay in shaded area throughout the year, since the nearby tree is too tall and block most of the incoming sunlight.
|
Season |
Total Roof Area (m^2) |
Total Shade Coverage (m^2) |
Shade Coverage % |
|
Summer |
24132 |
6336 |
26.26 |
|
Winter |
24132 |
4535 |
18.79 |
Form above result, we can see that there is no significant difference between winter shadow coverage on each house and the summer shadow coverage on each house. Thus, we can conclude that the presence or the absence of leaves (or the crown size of each tree) is not the main factor causing high shadow coverage on each nearby house. This result further indicates that the city tree department should take care of every tree and prune them frequently throughout the year.
In addition, form final map 3, we can see over 50% of the nearby houses are experiencing the danger of fallen trees, especially, those houses located on the east side of Blenheim Street and houses located along 28th and 27th Avenue. These houses are having high risk because the street tree located next to them are very tall, which have a higher possibility of falling (King, 1986). And the trees not fall on houses could also fall on streets, which will block traffic.
All of above analysis show that if the city cannot manage the urban trees properly, it will bring negative influence as well as danger to residents nearby.
The LiDAR data has been used in the first part of analysis is very old, it was published on 2013. This project was analyzing trees, and the from the research in methods section we can see that some of the trees have the amazingly fast growing speed. From 2013 to 2018, the size of tree canopy can increase significantly. This will cause the precision and accuracy of the analysis decrease. The current results (at year 2019) of tree shadow size on each nearby house are predicted to be larger than that in this project.
It is worth to mention that the city of Vancouver published a new LiDAR data of 2018 after I finished this project. So, for future analysis, it is worth to analyze the 2018 data and compare the result with this project’s result. By analysis the difference between 2018 and 2013, we can see how the shadow coverage increase or decrease during the past 5 years, and therefore we can conclude whether the city is making a effective management of city trees.
The shadow coverage value is not the real tree shadow size on each rooftop, it is just an indicator of which house and which aspect of the rooftop could be influenced. This is due to each building has its own height, some part of the tree shadow will be projected on the wall, as shown in below.


Figure 6. Tree shade Projection in this analysis (left), and real-world projection (right).
Due to this reason, the actual shade size on each building’s rooftop is smaller than predicted. However, it still influences people’s life, because the tree still blocks the sunlight shining through the windows or balcony. Thus, frequent pruning is needed.
Also, the area of fallen tree damage is actually smaller than predicted. Because not every tree will fall form its roots, it can also fracture form the trunk (as illustrated below).

Figure 7. The potential tree falling area in this analysis—the uprooting situation (left), and another possible situation in real-world (right).
Due to this reason, many houses in the study area may not be influenced by fallen tree. But this does not mean the potential danger is gone. As mentioned before, there are many reasons could contribute to falling of a tree, one very important contributor is the wind power, very strong wind can carry the fallen branches and even fallen trees to anywhere.
In addition, many trees do not fall only because of strong wind, they fell because their roots are damaged by soil microorganism and topographic exposure (Schaetzl et.al., 1989). These damages can be detected by frequent field check of each tree. Therefore, the city needs pay more attention to city tree management.
Based on above discussion about the potential error, some further studies can be conducted to correct those minor inaccuracy in this project.
1. For example, to take all factor (i.e. wind power, tree trunk strength, crown size, etc.) that could influence the falling of tree into consideration. A weight overlay model can be used to determine each factors’ influence on the tree falling situation. And produce a more precise and more accurate analysis on fallen tree danger.
2. Also, this study can extend to rooftop shade coverage analysis for solar panel. Analyzing where is the potential shaded area on rooftop can provide some clue on where to install the solar panel on each house’s roof.
3. If expand the study area to whole city, the result can become a risk assessment of wind storm damage, and it will indicate where should be taken care of when wind storm come, and which houses will be influenced by the wind storm.
Find Trees – Tree Guide. (2019). Arbor Day Foundations. Retrieved from https://www.arborday.org/trees/treeGuide/TreeList.cfm.
E-Flora BC. (2019). Retrieved from http://linnet.geog.ubc.ca/DB_Query/QueryForm.aspx.
King, D. A. (1986). Tree form, height growth, and susceptibility to wind damage in Acer saccharum. Ecology, 67(4), 980-990.
Li, Y., Gong, P., & Sasagawa, T. (2005). Integrated shadow removal based on photogrammetry and image analysis. International Journal of Remote Sensing, 26(18), 3911-3929.
Rentch, J. S. (2010). Relationship between treefall direction, slope-aspect, and wind in eight old-growth oak stands in the Central Hardwood Forest, USA. The Journal of the Torrey Botanical Society, 137(4), 391-401.
Schaetzl, R. J., Johnson, D. L., Burns, S. F., & Small, T. W. (1989). Tree uprooting: review of terminology, process, and environmental implications. Canadian Journal of Forest Research, 19(1), 1-11.
Street Tree By-law NO.5985 (1992). Retrieved from: https://vancouver.ca/docs/bylaws/5985c.PDF
SunCalc. (2013). Retrieved from: https://www.suncalc.org/#/49.2573,-123.1241,3/2019.12.07/00:43/1/3
VanConnect. (2019). Retrieved from: https://vancouver.ca/home-property-development/tree-service-request-form.aspx
Vancouver Open Data Portal. (2019). Retrieved from: https://opendata.vancouver.ca/pages/home/
Vancouver Historical Wind Speed. (2019). Retrieved from:https://vancouver.weatherstats.ca/metrics/wind_speed.html